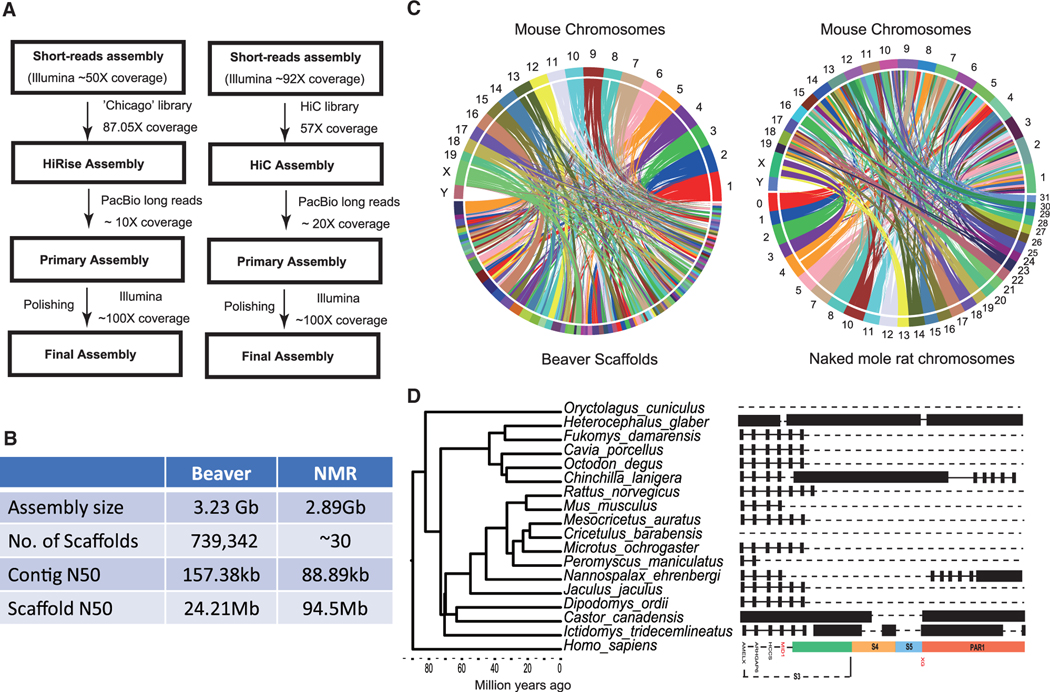
Figure 1. Beaver and NMR Genome Assemblies Support Robust Synteny Analysis in Rodents.
(A) Schematic diagram of beaver and NMR genome assemblies. (Left) North American beaver. (Right) NMR.
(B) Genome statistics of beaver and NMR genome assemblies.
(C) Circle plots of mouse genome synteny to beaver (left) and NMR (right) genomes.
(D) Comparative organization of genes in eutherian PARs. Evolutionary strata (S3–S5) of human sex chromosomes are referenced and shown at the bottom.

