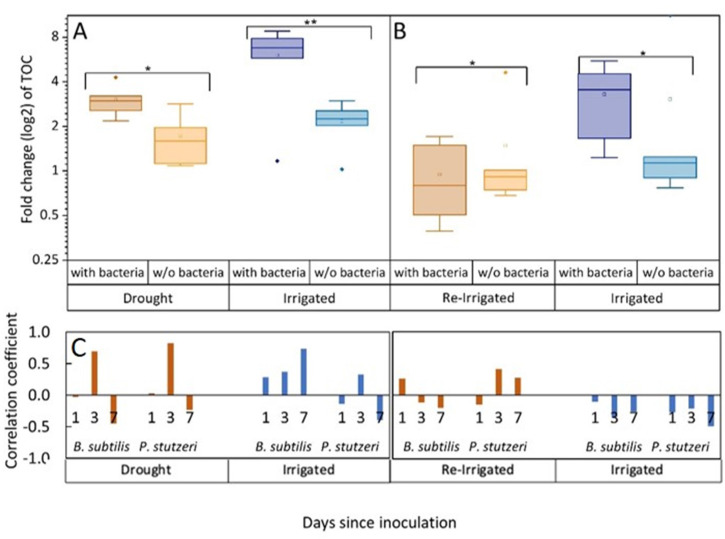
Figure 2. Tree root exudates increase with bacterial inoculation for both the drought and irrigation treatments (A) and decrease with bacterial inoculation after rewetting the droughted trees (B).
Total organic carbon (TOC) in exudate solutions from roots of irrigated and drought-exposed Cupressus sempervirens saplings, with and without bacterial inoculations. Intact roots were incubated for 48 hr to collect exudates during periods of drought (A) and re-irrigation (B). Boxplots show the log 2 of fold change from baseline exudation rate (at the beginning of the experiment) in µg C mg root–1 day–1. Asterisks indicate significant differences based on two-way ANOVA performed with Tukey’s HSD test (n=6, p<0.05) (see Figure 2—source data 2). Coefficients for the correlations between exudate rate (TOC) and rhizosphere abundance of Bacillus subtilis or Pseudomonas stutzeri (as in Figure 1) for the specific tree groups at 1, 3, and 7 days following inoculation (C).


