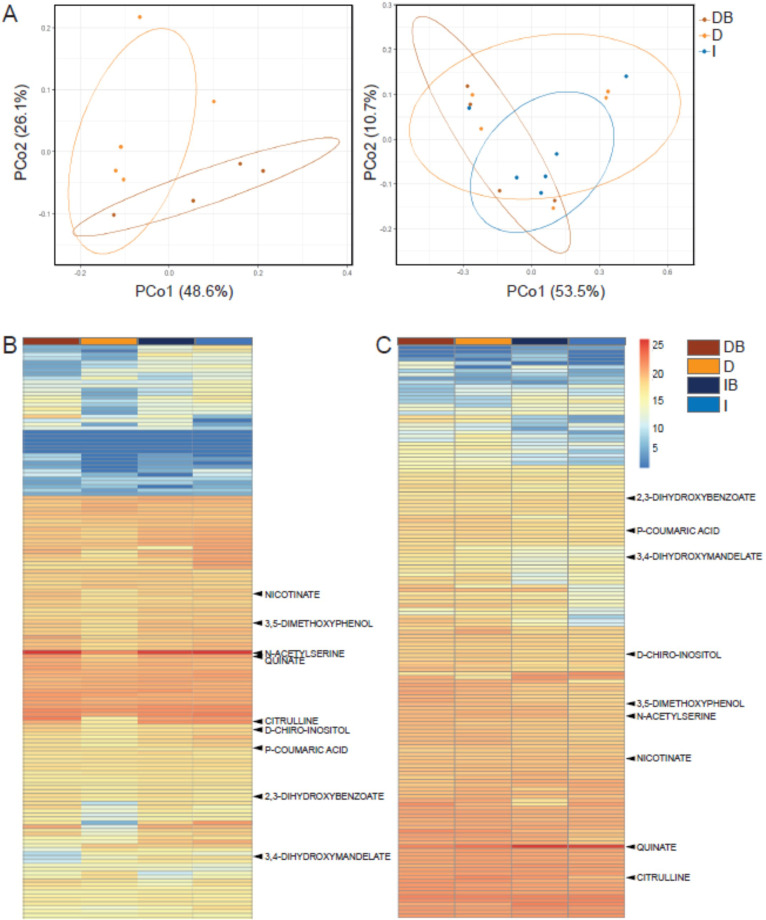
Figure 3. Rhizosphere bacteria and drought induce systemic metabolic changes in root exudates.
Metabolic profiles of root exudate solutions from roots of irrigated and drought-exposed Cupressus sempervirens saplings, with and without bacterial inoculations. Intact roots were incubated for 48 hr to collect exudates, which were analyzed by mass spectrometry. (DB) drought with bacteria, (D) drought w/o bacteria, (IB) irrigated with bacteria, (I) irrigated w/o bacteria. (A) Principal coordinate analysis of the polar metabolite profiles of exudates from drought-exposed saplings with and without bacterial inoculations (DB and D, respectively; left), and in combination with irrigated saplings (I; right; excluding the group of irrigated trees with bacteria for clarity). (B) Heat map analysis of the fold change of each of 149 identified metabolites (rows) relative to control level (at the beginning of the experiment). Columns represent means for each of the four saplings groups (n=4–6). (C) Same as in (B) for the re-irrigation phase. The nine metabolite names indicate metabolites which were tested in vitro for bacterial growth. For the list of metabolites, see Figure 3—source data 1.


