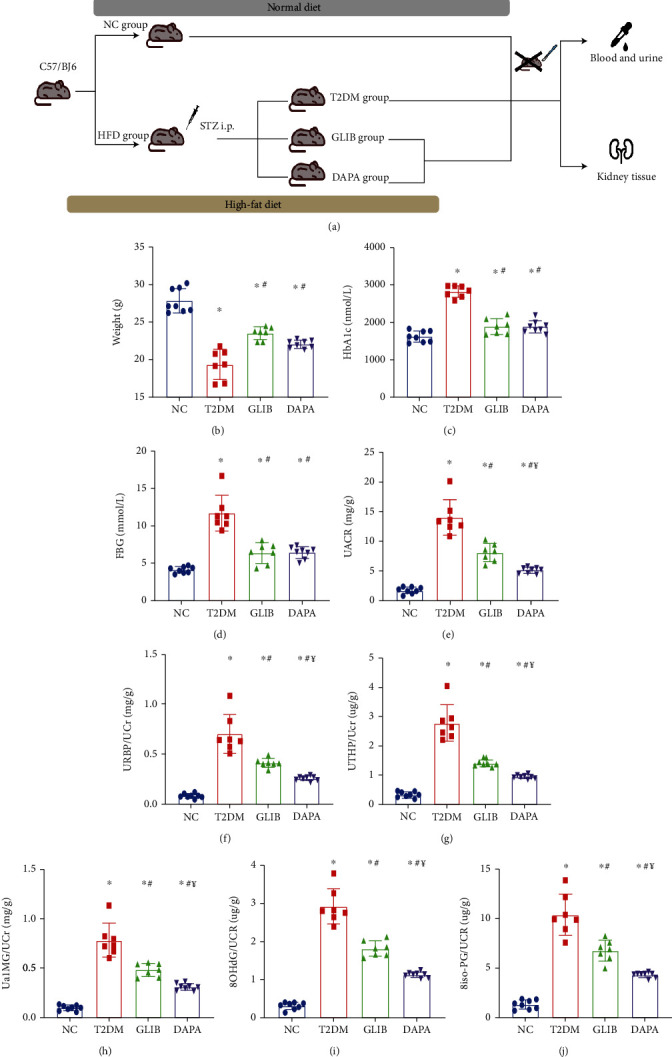
Figure 1.

The additional renal protective effect of dapagliflozin in T2DM mice: (a) workflow of the experiment; (b) body weights in each group; (c) HbA1c concentrations in each group; (d) FBG concentrations in each group; (e) urinary ACRs; (f) urinary RBP/creatinine ratio; (g) urinary THP/creatinine ratio; (h) urinary a1MG/creatinine ratio; (i) urinary 8-OHdG/creatinine ratio; (j) urinary 8iso-PG/creatinine ratio. Values are the mean ± SD. n = 7 mice in the T2DM group and GLIB group, respectively; n = 8 mice in the NC group and DAPA group, respectively. ∗P < 0.05 vs. NC; #P < 0.05 vs. T2DM; ¥P < 0.05 vs. GLIB.
