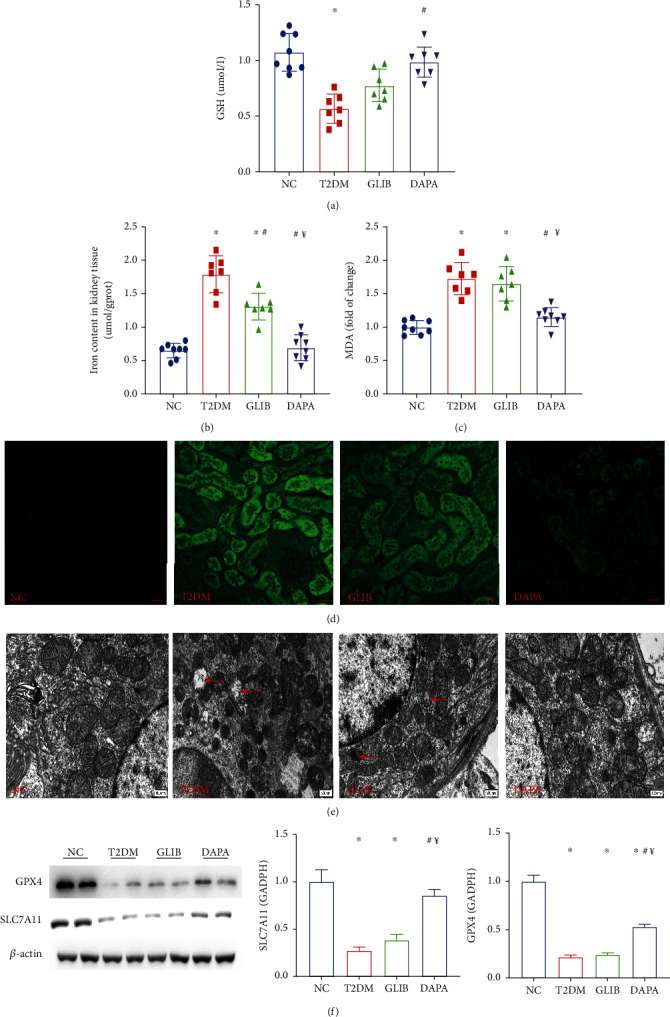
Figure 3.

Dapagliflozin ameliorated ferroptosis in T2DM mice. (a) GSH, (b) iron, and (c) MDA contents in the kidneys of mice in these groups. (d) The production of ROS (green) in each group. (e) Transmission electron microscopy was used to detect the mitochondrial morphology of renal tubular epithelial cells in each group. The red arrow indicates the damaged mitochondria (ruptured mitochondrial membranes and the disappearance of mitochondrial cristae). (f) Quantification of the average band densities calculated from different western blots and the protein levels of GPX4 and SLC7A11 in the kidney tissue in these groups. Values are the mean ± SD. n = 7 mice in the T2DM group and GLIB group, respectively; n = 8 mice in the NC group and DAPA group, respectively. ∗P < 0.05 vs. NC; #P < 0.05 vs. T2DM; ¥P < 0.05 vs. GLIB.
