
Figure 8.
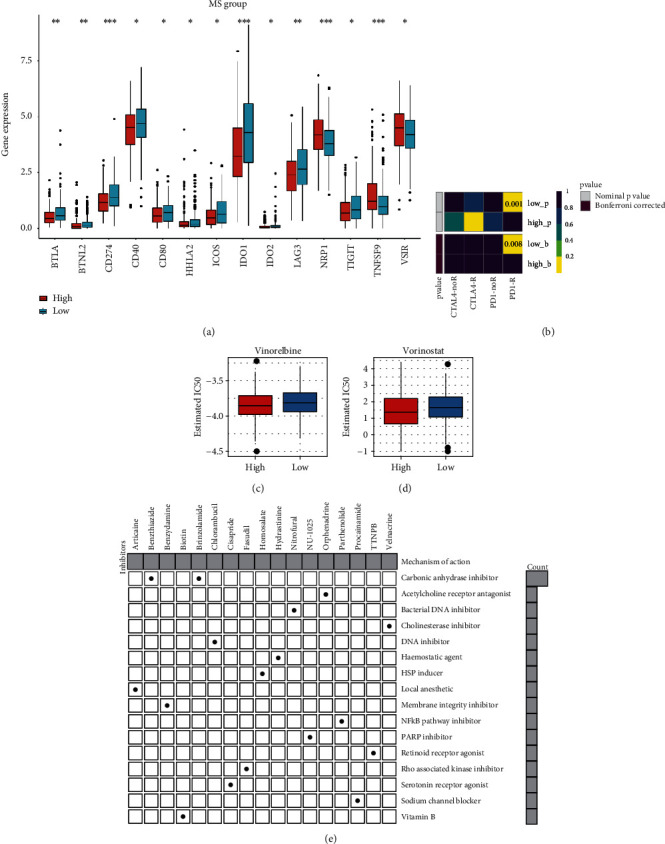
Immune checkpoint and chemotherapeutic reaction analyses. (a) Differential expression analysis of immune checkpoint in MS groups. (b) Heatmap of expression of PD1 and CTLA4. (c) IC50 of vinorelbine in MS groups. (d) IC50 of vorinostat in MS groups. (e) CMap analysis to identify the potential compounds targeting between MS groups and their corresponding mechanisms.