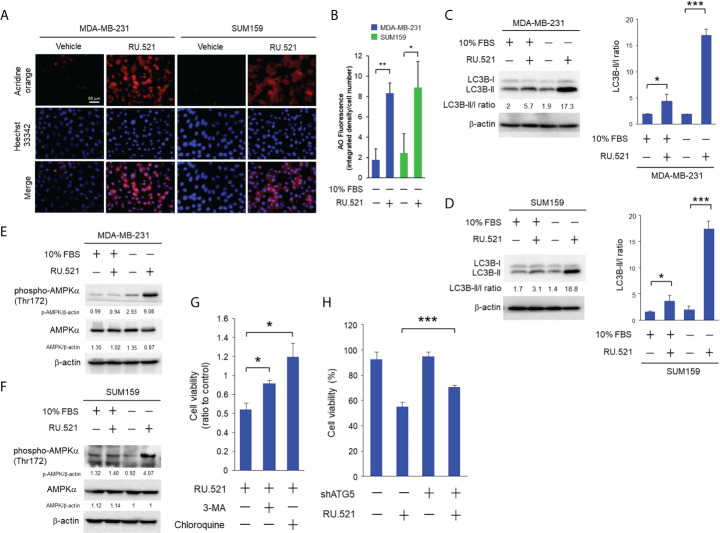
Figure 4.
RU.521 induced cell death by autophagy in TNBC cells cultured in serum-depleted media. (A), MDA-MB-231 and SUM159 cells were treated with RU.521 at 10 μM and 8 μM, respectively, in serum-depleted media for 48 hr. Cells were then stained with acridine orange and the red fluorescence signaling were captured by fluorescence microscopy at 400x magnification. Bar, 50 μm. The nuclei were counterstained by Hoechst 33342 (blue). (B), The relative fluorescence intensity was quantitated. The data of three independent biological repeats are shown as means ± SD. *, p < 0.05; **, p < 0.01. Statistical significance was calculated by Student’s t-test. (C, D), Expression of the LC3B-l and LC3B-ll proteins in MDA-MB-231 (C) and SUM159 (D) was determined by Western blotting analysis with an anti-LC3B antibody (upper panels). β-actin expression was served as a loading control. For each cell line, the relative fluorescence intensities were quantitated (lower panels). The data of three independent biological repeats are shown as means ± SD. *, p < 0.05; ***, p < 0.001. Statistical significance was calculated by Student’s t-test. (E, F) Expression of total AMPK and pT172-AMPK in MDA-MB-231 (E) and SUM159 (F) cultured in the presence and absence of 10% FBS and RU.521 were analyzed by Western blotting analysis with the corresponding antibodies. β-actin expression was served as a loading control. (G), MDA-MB-231 cells were pre-treated with 3-MA (5 mM) or chloroquine (2 μM) in serum-depleted medium for 1 hr, followed by treatment with RU.521 (8 μM) for 24 hr. (H), ATG5 expression of MDA-MB-231 cells was down-regulated by an ATG5-specific shRNA, followed by treatment with RU.521 (8 μM) in serum-depleted media for 24 hr. Cell growth was determined by crystal violet staining and detected by absorbance at OD 595 nm. The data from three independent biological repeats were plotted and presented as means ± SD. Statistical significance was calculated by Student’s t-test. ***, p < 0.001.

