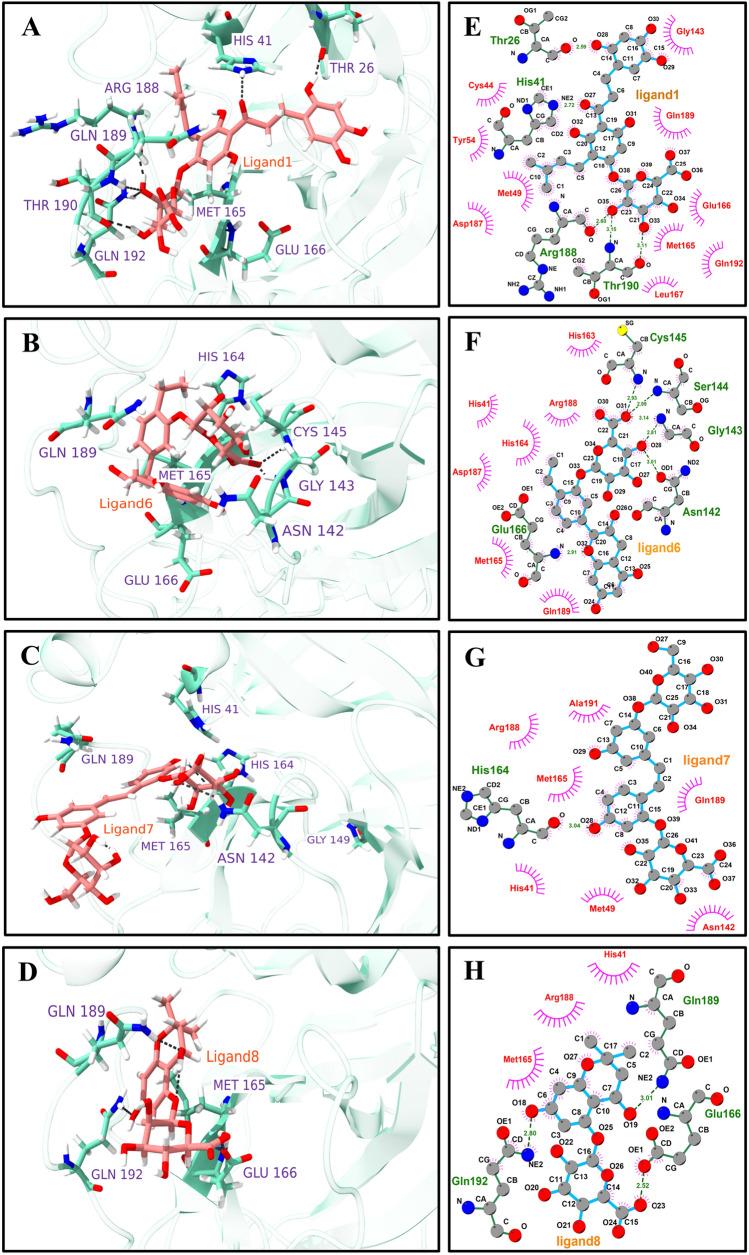
Fig. 7.
The main protease, 3CLpro, and human metabolites interaction profiles (affinity more than − 9 kcal/mol). 3D interaction profile for selected ligands where key residues are shown ball and stick model A Ligand1, B Ligand6, C Ligand7, and D Ligand8. 2D interaction plots are generated by using Ligplot+, E Ligand1, F Ligand6, G Ligand7, and H Ligand8. Pink spike semicircles show the residues involved in the hydrophobic interactions, and hydrogen bonds are shown as green dotted lines

