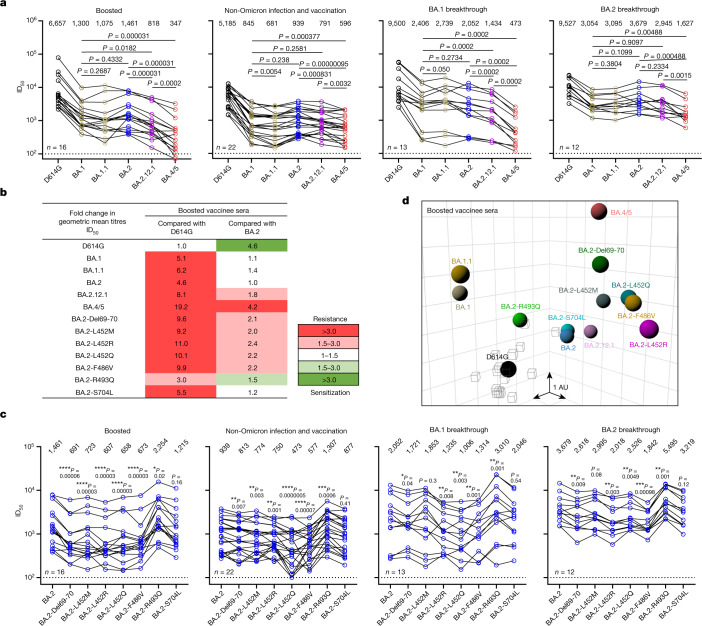
Fig. 4. BA.2.12.1 and BA.4/5 exhibit greater serum neutralization resistance profiles relative to BA.2.
a, Neutralization of pseudotyped D614G and Omicron subvariants by sera from four different clinical cohorts. b, Fold change in geometric mean ID50 titres of boosted vaccinee sera relative to D614G and BA.2, with resistance coloured red and sensitization coloured green. c, Serum neutralization of BA.2 pseudoviruses containing single mutations found within BA.2.12.1 and BA.4/5. d, Antigenic map based on the neutralization data of boosted vaccinee sera. SARS-CoV-2 variants are shown as coloured circles and sera are shown as grey squares. The x, y and z axis represent antigenic units (AU) with one grid corresponding to a two-old serum dilution of the neutralization titre. An interactive map is available online (https://figshare.com/articles/media/OmicronAntigenicMap/19854046). The map orientation in the x, y and z axis is free to rotate. For all the panels in a and c, values above the symbols denote the geometric mean ID50 values and values on the lower left show the sample size (n) for each group. P values were determined by using two-tailed Wilcoxon matched-pairs signed-rank tests. The results shown are representative of those obtained in two independent experiments.

