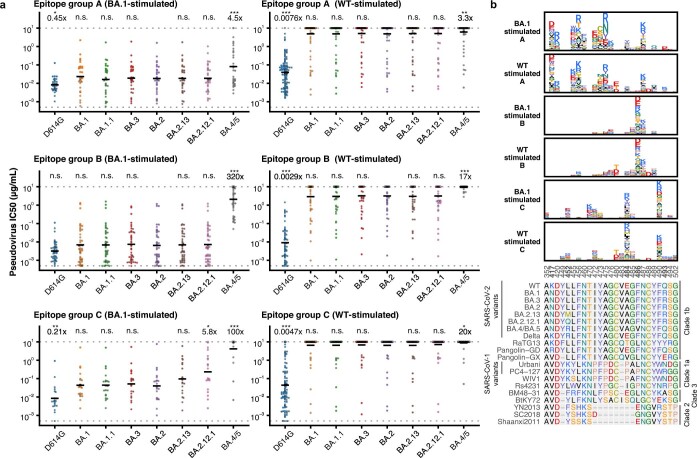
Extended Data Fig. 7. Comparison of BA.1-stimulated and WT-stimulated antibodies in group A, B and C.
a, Neutralizing activity against SARS-CoV-2 D614G and Omicron subvariants by BA.1-stimulated (A, n = 30; B, n = 41; C, n = 20) and WT-stimulated (A, n = 98; B, n = 55; C, n = 88) antibodies in Group A, B and C. Geometric mean of IC50 fold changes compared to IC50 against BA.2 are annotated above the bars. P-values were calculated using a two-tailed Wilcoxon signed-rank test of paired samples, in comparison to IC50 against BA.2. *, p < 0.05; **, p < 0.01; ***, p < 0.001; n.s., not significant, p > 0.05. All neutralization assays were conducted in biological duplicates. b, Averaged escape maps at escape hotspots of BA.1-stimulated and WT-stimulated antibodies in group A, B and C, and corresponding MSA of various sarbecovirus RBDs. Height of each amino acid in the escape maps represents its mutation escape score. Mutated sites in Omicron variants are marked in bold.

