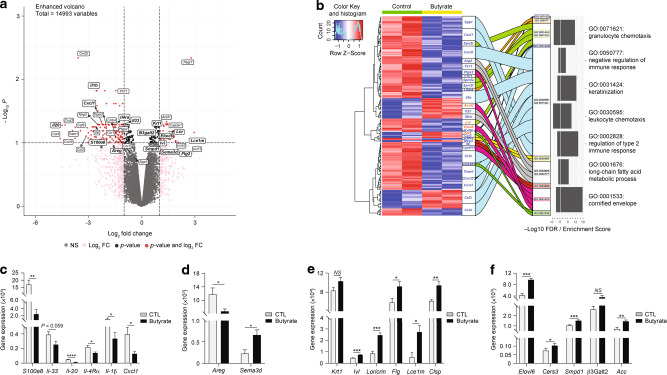
Fig. 2. Butyrate alters the skin transcriptome following allergen exposure.
a Volcano plot of differentially expressed genes (DEGs) after transcriptomics analysis of HDM allergen-sensitized skin from control or butyrate-treated mice (false detection rate (FDR) < 0.1; fold-change = 2). b Gene ontology (GO) analysis of lesional skin transcriptomics. Heatmap and alluvial plot of select DEGs (blue = decreased and red = increased in butyrate-treated mice) linked to GO IDs. Mirrored box plot indicates −log10 FDR on left and enrichment score on right for each GO ID. Gene expression analysis by quantitative RT-PCR of key genes involved in atopic dermatitis inflammation (c), itching pathway (d), keratinocyte differentiation and cornification (e), and lipid/ceramide synthesis and cornified lipid envelope formation (f) in skin from control (CTL) or butyrate-treated animals after 2 weeks HDM sensitization. Gene expression was normalized to β-actin. Results are representative of data from one experiment in a and b, and from three independent experiments in c–f. All results are expressed as mean ± SEM (n = 2 per group in a, b; n = 6 per group in c–f). Statistical significance was determined with Student’s t-test (unpaired, two-tailed) or Mann–Whitney test in c–f. NS = non-significant, *P = 0.05, **P = 0.01, ***P = 0.001, and ****P = 0.0001.

