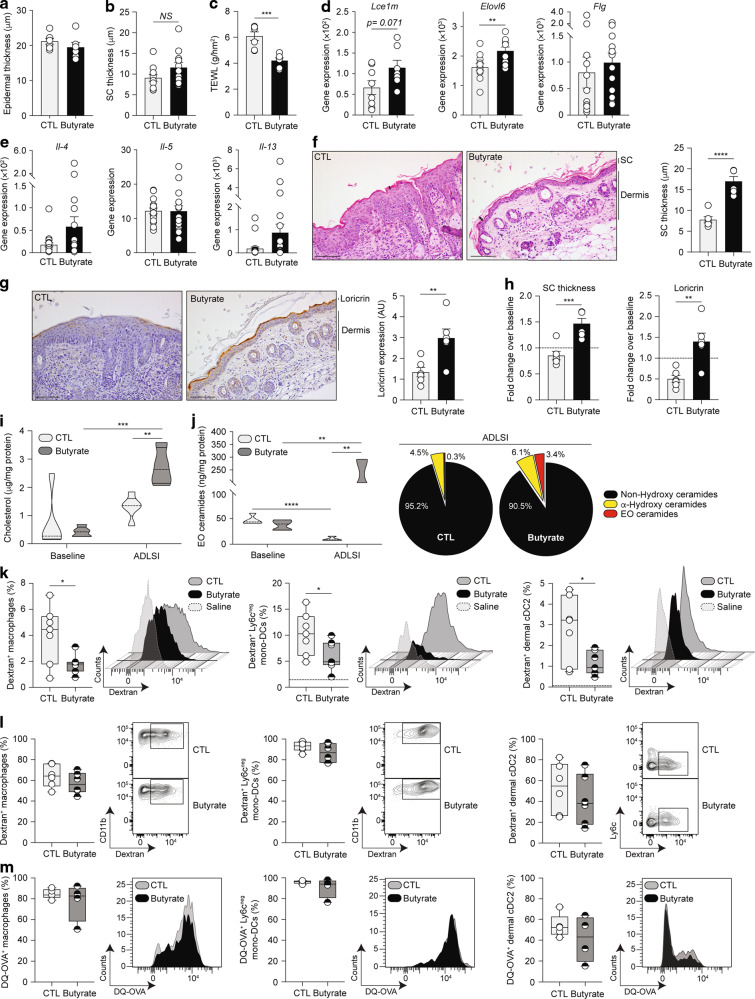
Fig. 4. Butyrate promotes skin barrier function.
a Quantification of baseline epidermal thickness in water control (CTL) or butyrate-treated mice before allergen sensitization. b Quantification of stratum corneum (SC) thickness following analysis of representative hematoxylin and eosin (H&E)-stained skin tissue before HDM allergen exposure. c Measurement of baseline dorsal transepidermal water loss (TEWL) in control or butyrate-treated mice before allergen exposure. d Expression of key components of the cornified envelope by fluorescence-activated cell sorting (FACS)-purified epidermal CD326+ keratinocytes isolated before allergen sensitization from CTL mice or butyrate-treated mice, as determined by quantitative RT-PCR. e Expression of TH2 cytokines in the skin at baseline, as determined by quantitative RT-PCR. Gene expression was normalized to β-actin in d and e. f Representative H&E-stained skin tissue from CTL or butyrate-treated mice after 2 weeks of HDM allergen exposure and corresponding quantification of stratum corneum (SC) thickness (randomly measured 3 times per picture, 7–8 pictures per sample). Arrows represent representative sites for SC thickness measurement. Scale bars, 100 μm. g Representative immunohistochemistry-stained skin tissue from CTL or butyrate-supplemented mice after 2 weeks of HDM allergen sensitization and corresponding quantification of loricrin expression (represented by a light-to-dark brown staining). Loricrin staining was measured in the entire picture, with 4 pictures per sample. Scale bars, 100 μm. h Fold-change (2 weeks HDM-sensitized over baseline) SC thickness and loricrin expression in the skin of CTL or butyrate-exposed animals. Dotted line represents an arbitrary value for baseline fold-change. i Absolute quantities of cholesterol in the skin of naive (“baseline”) and HDM allergen-sensitized (“ADLSI”) CTL and butyrate-treated mice, as determined by ultrahigh performance supercritical fluid chromatography coupled to quadrupole time-of-flight mass spectrometry with electrospray ionisation (UHPSFC/ESI-QTOF-MSE). j Distribution of the main classes of ceramides and absolute quantities of Ester-linked-Omega-hydroxy (EO) ceramides, as determined by ultrahigh performance liquid chromatography coupled to tandem mass spectrometry with electrospray ionisation (UPLC/ESI-MS/MS). k Frequencies and representative histograms of FITC-dextran-positive MHCII+ dermal macrophages, Ly6cneg mono-DC, and CD11b+ cDC2 in the skin of two-time HDM allergen-sensitized control (CTL) or butyrate-treated animals after one topical administration of 100 μg FITC-dextran (10 KDa). Saline = HDM-exposed skin without FITC dextran administration (saline-treated). Frequencies and representative histograms of FITC positive cells in the skin of two-time HDM allergen-sensitized CTL or butyrate-supplemented mice after one intradermal administration of 100 μg FITC-dextran (l) or 100 μg DQ-OVA (m). Results are representative of data from 3 independent experiments in a and C, pooled from 2 independent experiments in b, d, pooled from 4 independent experiments in e, from at least three independent experiments in f–h, from one independent experiment in i, j, and from two independent experiments in k–m. All results are expressed as mean ± SEM (n = 7 CTL and n = 6 butyrate in a and c; n = 11 per group in b; n = 8/12 for CTL and n = 7/11 for butyrate in d; n = 16/23 for CTL and n = 15/23 for butyrate in e; n = 6 per group in f–h and l; n = 5 CTL “baseline”, 5 CTL “ADLSI”, 5 butyrate “baseline”, and 4 butyrate “ADLSI” in i; n = 5 CTL “baseline”, 4 CTL “ADLSI”, 5 butyrate” baseline”, and 3 butyrate “ADLSI” in j; n = 7 per group in k; n = 5 CTL and 4 butyrate in m). Statistical significance was determined with Student’s t-test (unpaired, two-tailed) in a–m, or Mann–Whitney test in e and k. *P = 0.05, **P = 0.01, ***P = 0.001, and ****P = 0.0001.

