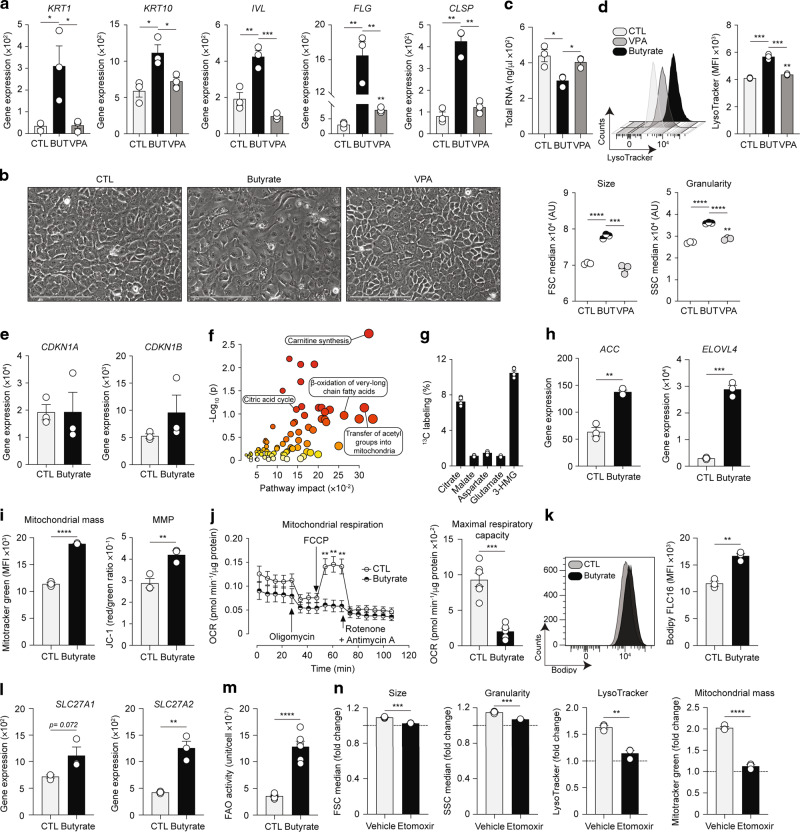
Fig. 6. Butyrate reprograms keratinocyte metabolism to induce mitochondria-dependent epidermal differentiation.
a Expression of skin barrier genes in HEK cultures either vehicle (CTL), 500 μM butyrate (BUT), or 500 μM valproate (VPA)-treated for 48 h, as determined by quantitative RT-PCR. b Representative phase-contrast micrographs of HEK cultures. Scale bars, 200 μm. c Total RNA quantification from HEK cultures. d Median size, granularity, and LysoTracker expression in HEK cultures, as determined by flow cytometry. MFI, mean fluorescence intensity. e Gene expression of CDKN1A and CDKN1B in HEK cultures, as determined by quantitative RT-PCR. f Pathway enrichment (based on the small molecule pathway database (SMPD)) and topology analyses of the multiple pathway targeted metabolomics data on FACS-isolated murine CD326+ keratinocytes highlighting several robustly altered metabolic pathways, as determined using MetaboAnalyst 5.0 software. g 13C enrichment in several intermediates and products of the citric acid cycle in HEK supplemented with 13C-butyrate for 24 h, as determined by Hydrophilic Interaction Liquid Chromatography coupled to high-resolution mass spectrometry. h Expression of malonyl-CoA-generating enzyme ACC and fatty acid elongation enzyme ELOVL4 in HEK cultures, as determined by quantitative RT-PCR. i Determination of mitochondrial mass and membrane potential (MMP) of HEK cultures, as assessed by flow cytometry using MitoTracker green and bivariate dye JC-1, respectively. j Mitochondrial respiration of CTL or butyrate-treated HEK for 48 h, as determined by oxygen consumption rate (OCR) Seahorse assays. FCCP, trifluoromethoxy carbonylcyanide phenylhydrazone. k Measurement of long-chain fatty acids (LCFA) uptake by HEK, as determined by flow cytometry using a synthetic fluorescent LCFA (Bodipy FLC16). l Expression of LCFA transporters and activators SLC27A1 and SLC27A2 in HEK cultures, as assessed by quantitative RT-PCR. m Quantification of fatty acid oxidation (FAO) activities in HEK cultures. n Effect of low-dose etomoxir (20 μM) on median size, granularity, lysosome contents, and mitochondrial mass in cultures, as determined by flow cytometry. Results are expressed as fold-change over CTL in the absence (“vehicle”) or presence of etomoxir. For data in a, e, h, and l, gene expression was normalized to β-ACTIN. Results are representative of data from two to three independent experiments in a, at least three independent experiments in b, d, h, k, and l, three independent experiments in c, i, j, m, and n, and from one experiment in f–g. All results are expressed as mean ± SEM (n = 3 per group in a–e, k, l, and n; n = 5 per group in f–g; n = 6 per group in m; n = 6 for CTL and n = 5 for butyrate in j). Statistical significance was determined with Student’s t-test (unpaired, two-tailed). *P = 0.05, **P = 0.01, ***P = 0.001, and ****P = 0.0001. See also Fig. S4.

