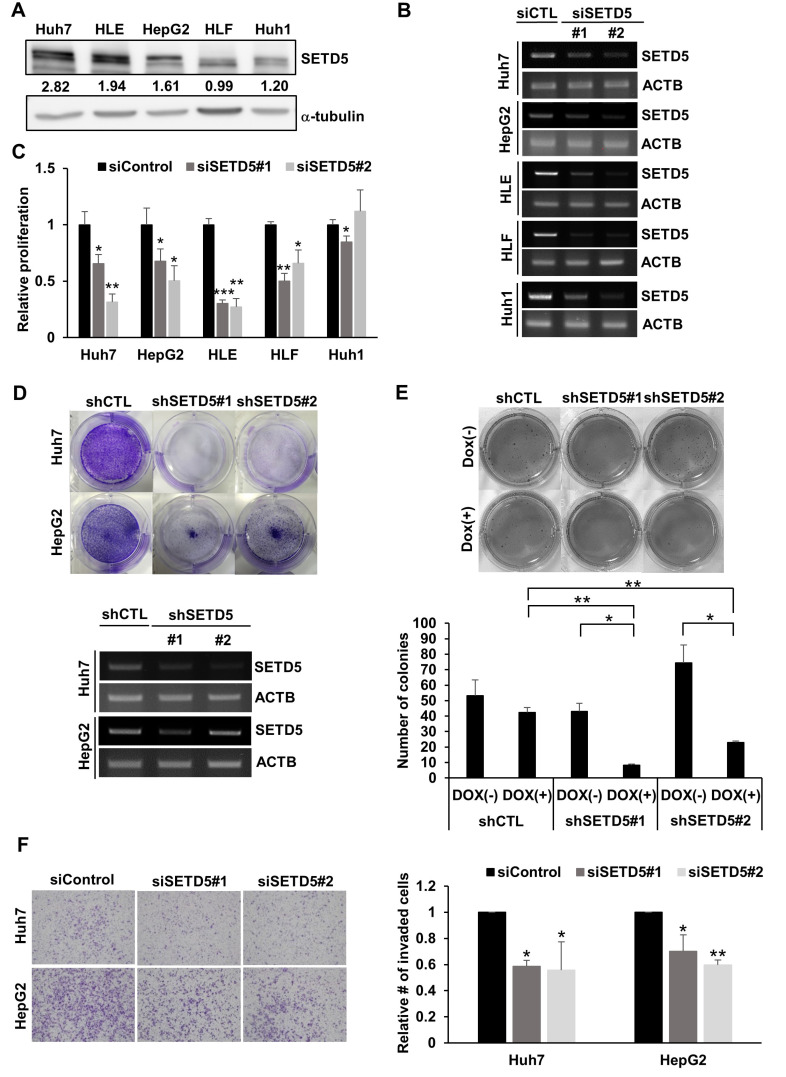
Fig. 2. SETD5 depletion impairs HCC cell proliferation and motility.
(A) Endogenous SETD5 protein levels in different HCC cell lines were determined by immunoblotting against SETD5. α-Tubulin served as the loading control. The intensities of immunoblotting signals were semiquantitatively measured by ImageJ. (B) RT-PCR to show siRNA-mediated SETD5 KD in different HCC cell lines. β-Actin served as the loading control. (C) SETD5 KD decreased proliferation in SETD5-depleted HCC cells, as determined by MTT assays (n = 3, *P < 0.05, **P < 0.01, ***P < 0.001, one-way ANOVA). (D) Upper: Clonogenic assay of Huh7 and HepG2 cells stably expressing shRNAs targeting SETD5 (shSETD5#1, shSETD5#2) and control shRNA (shCTL). Lower: SETD5 depletion was verified by RT-PCR visualized in agarose gel. ACTB was used as a loading control for RT-PCR. (E) Upper: Representative image of the soft agar assay to examine anchorage-independent growth of SETD5-depleted Huh7 cells. SETD5 KD was induced by doxycycline treatment. Dox(+) denotes cells treated with doxycycline, whereas Dox(–) indicates cells without doxycycline treatment. Lower: Quantification of colony numbers in soft agar assays counted by ImageJ (n = 3, *P < 0.05, **P < 0.01, one-way ANOVA). (F) Left: Transwell invasion assays showed that SETD5 KD in the indicated cells attenuated the invasion capacity. Right: The number of invaded cells was normalized to the control group (n = 3, *P < 0.05, **P < 0.01, one-way ANOVA).

