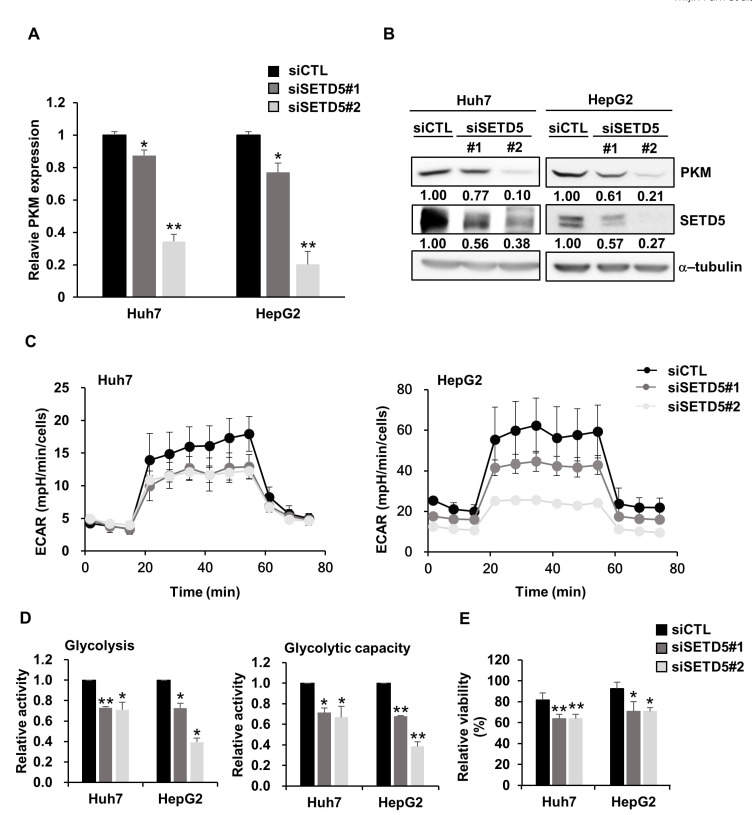
Fig. 6. SETD5 controls the glycolytic rate in HCC.
(A and B) In SETD5-depleted Huh7 and HepG2 cells, PKM expression was downregulated at both the mRNA (A) and protein levels (B). The numbers indicate the value of semiquantified immunoblotting bands by ImageJ. Statistical significance was determined by one-way ANOVA (*P < 0.05, **P < 0.01). (C) The ECAR in SETD5-depleted HCC cells upon the sequential addition of glucose (25 mM), oligomycin (1 µM), and 2-DG (50 mM). ECAR values were normalized to the number of cells. All experiments were performed independently in triplicate. (D) Glycolysis and glycolytic capacity were quantified in SETD5-depleted Huh7 and HepG2 cells. Relative activity was normalized to the values for siCTL. Values are the mean ± SEM of biological triplicate experiments. (n = 3, *P < 0.05, **P < 0.01, one-way ANOVA). (E) SETD5-depleted Huh7 and HepG2 cells were treated with 2.5 mM 2-DG for 48 h. Cell viability was measured using the Cell titer-Glo assay. Relative viability indicates the viability of cells treated with 2-DG normalized to those treated with vehicle only. Values are the mean ± SEM of biological triplicate experiments (n = 3, *P < 0.05, **P < 0.01, one-way ANOVA).

