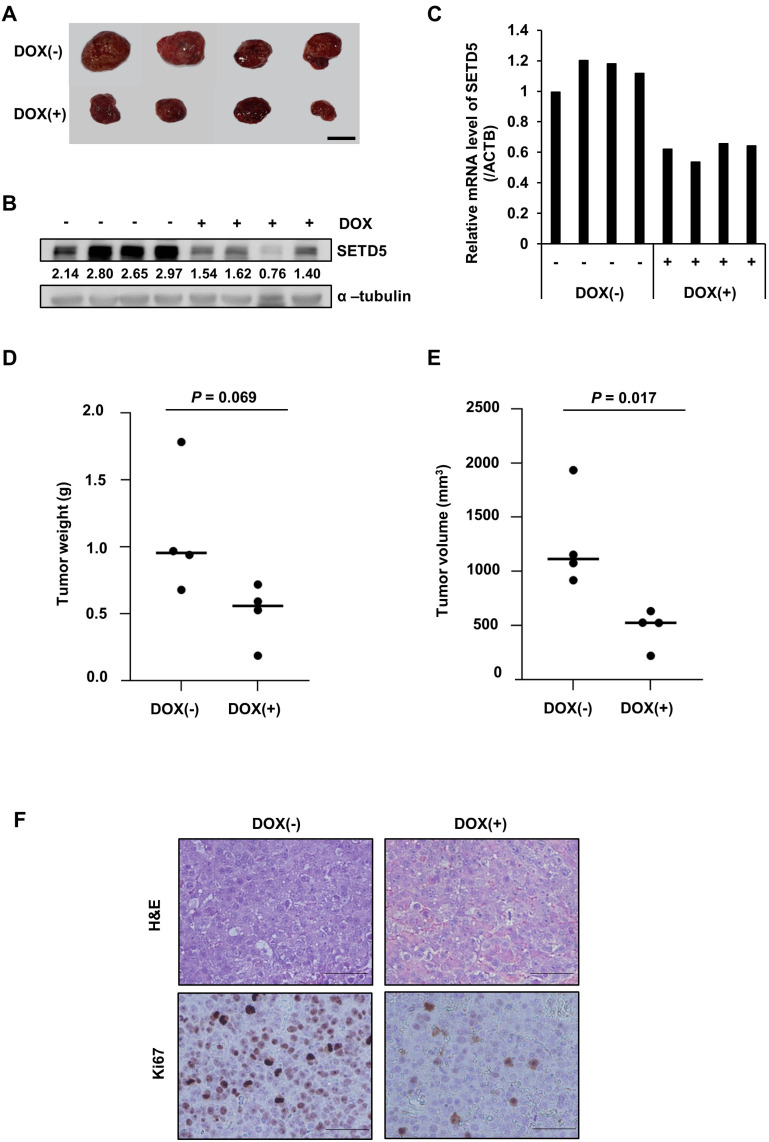
Fig. 7. SETD5 depletion inhibited tumorigenesis in vivo.
(A) Images of tumors taken from xenograft mice fed doxycycline (DOX(+)) or control diets (DOX(–)) for 13 days. (B and C) SETD5 protein (B) and mRNA levels (C) in the tumor tissues displayed in (A). The numbers indicate the value of semiquantified immunoblotting bands by ImageJ. (D and E) Tumor weight and size were measured at the time mice were sacrificed. Statistical significance was determined by Student’s t-test. (F) Representative images of H&E staining and immunohistochemistry for Ki67 in paraffin-embedded tumor sections. Scale bars = 200 µm.

