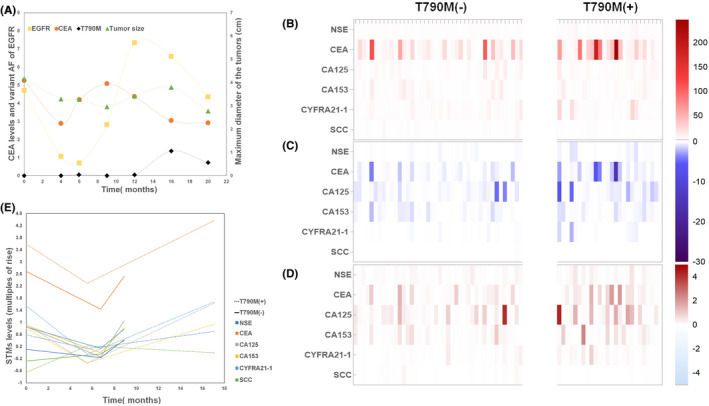
FIGURE 2.

Dynamic changes of STMs, ctDNA, and tumor size. Changing trends of CEA (the logarithm of the CEA value), EGFR, and tumor size during EGFR‐TKI treatment. Each line represents the average value of patients in the corresponding group. Since the follow‐up times for each test were not synchronous, we used intervals of 2–4 months to compare the dynamic changes between groups. The actual follow‐up times for each test are controlled within plus or minus 1 month of the corresponding timepoint. We divided the whole treatment process into seven timepoints: 0, 4, 6, 9, 12, 16, and 20 months after the initiation of targeted therapy. (A). Heat maps and line charts of the STMs in the T790M subgroup and the non‐T790M subgroup; Multiples of the rise of the STMs at baseline(B). Decrease slope of the STMs in the responsive stage(C). Increase slope of the STMs in the resistant stage(D). The overall trend (The logarithm of the STM level) of STMS in the non‐T790M resistant subgroup (dotted lines) and the T790M resistant subgroup (solid lines) (E)
