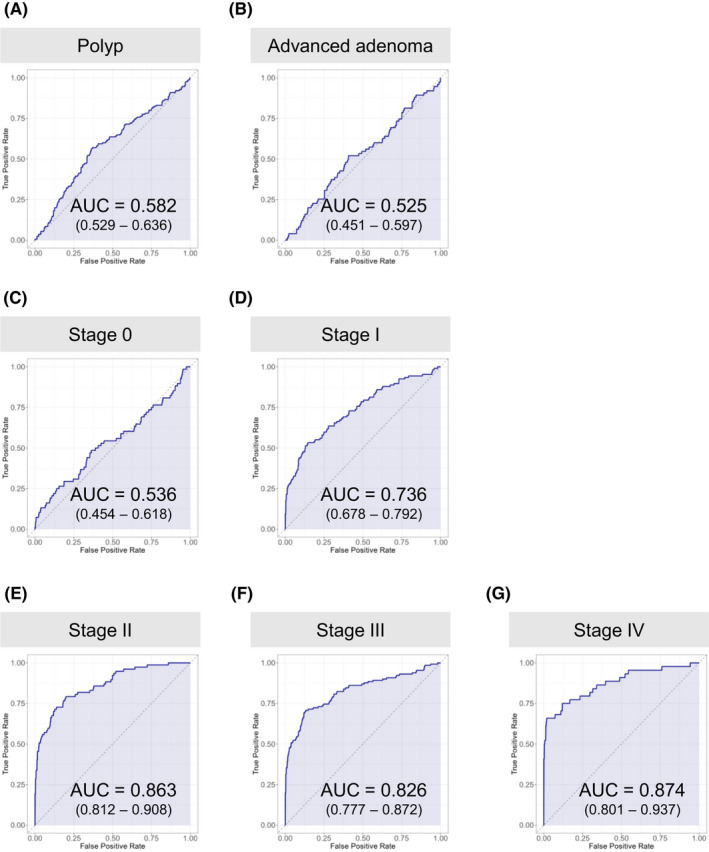
Figure 2.

Evaluation of CRC diagnostic model by ROC curve. (A)–(G) ROC curves were drawn separately for the different sample categories and for each stage of CRC progression. Healthy individuals with colorectal polyps (A), advanced adenoma patients (B), Stage 0 (C), Stage I (D), Stage II (E), Stage III (F), Stage IV (G). AUC (area under the curve). Ranges in parentheses are 95% confidence intervals with 10,000 bootstrap replicates
