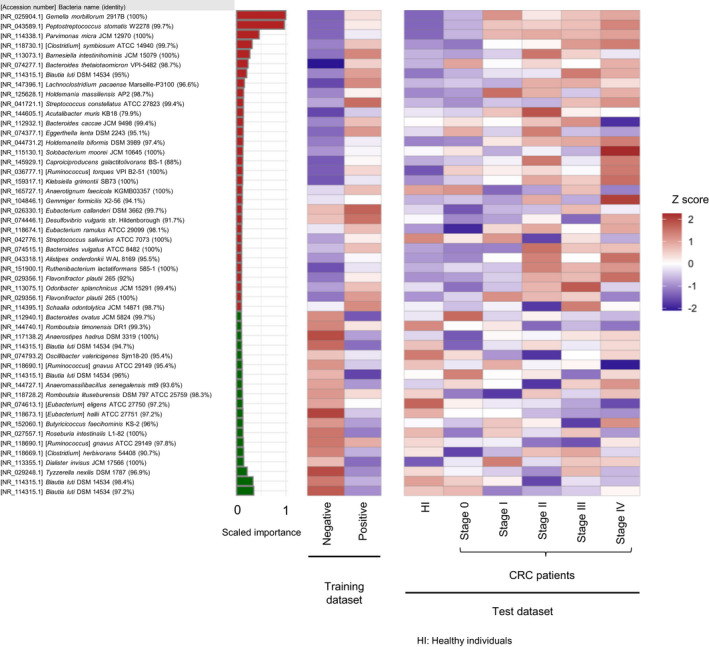
Figure 3.

The top 50 most important bacteria (OTUs) for diagnosis in our CRC diagnostic model developed in this study. The heat map shows the mean relative abundance of the top 50 most important bacteria (OTUs) for diagnosis in our CRC diagnostic model in the training and test datasets. The bar chart shows the scaled feature (variable) importance of each OTU. The color of bar chart is red if the average relative presence ratio of positive samples is greater than the average relative presence ratio of negative samples in the training dataset, and green otherwise. The relative amounts were multiplied by 10,000 and logarithmically transformed (pseudo‐count = 1), then the mean of each sample group was calculated and finally normalized by the z‐score
