
Table 2.
Gene expression data of specific differentiation and cell type markers.
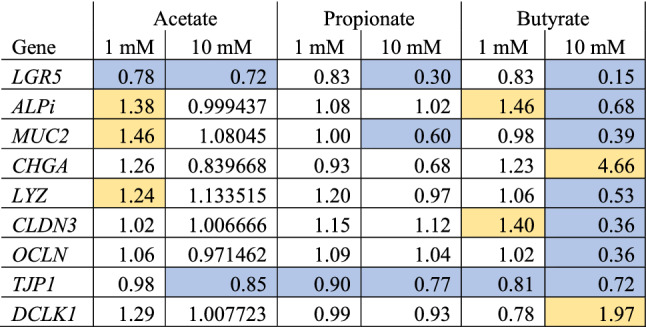
Gene expression ratios in induced pluripotent stem cell derived intestinal epithelial cell layers exposed to 1 or 10 mM butyrate, propionate or acetate for 24 h compared with the control. Each ratio is based on the average expression data of 3 samples. Blue cells are significantly downregulated and yellow cells are significantly upregulated (P < 0.05). The markers represent stem cells (LGR5), enterocytes (Alkaline Phosphatase intestinal; ALPi), goblet cells (Mucin 2; Muc2), enteroendocrine cells (chromogranin A; CHGA), paneth cells (Lysozyme; LYZ), tight junction proteins (Claudin-3; CLDN3, Occludin; OCLN and Zonule-occludens 1; TJP1), and tuft cells (Doublecortin Like Kinase 1; DLK1).