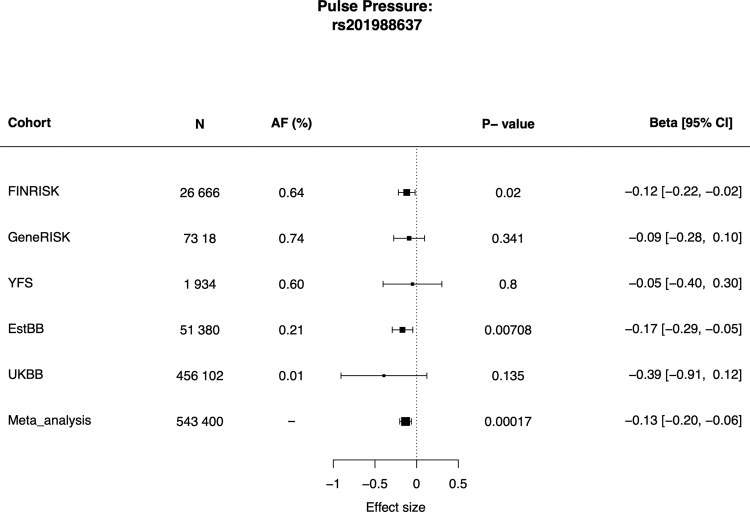
Fig. 7. Results for pulse pressure association across all cohorts with splice acceptor variant rs201988637 available (FINRISK, GeneRISK, YFS, EstBB, and UKBB).
Size of the boxes represent the sample size of the cohorts, and the lines the 95% confidence interval. Associations were tested using linear regression, adjusting for age and sex Pulse pressure phenotypes were inverse-rank normalized prior analysis. Source data for the figure is in Supplementary Data 1.

