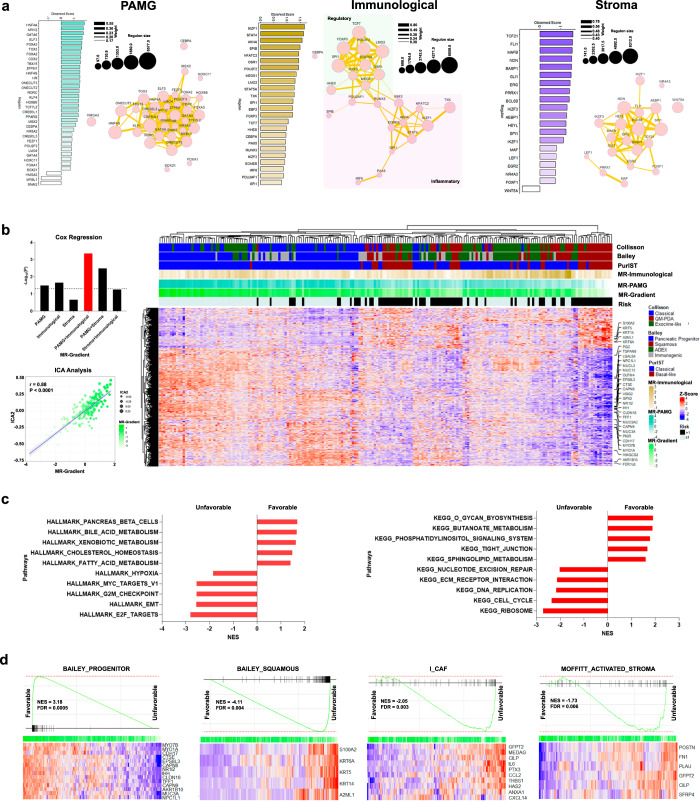
Fig. 2. Transcriptional Master Regulator (MR) gradient and tumoral phenotype characterization.
a Transcriptional network and enrichment score of key regulons after regulatory transcriptional network (RTN) analysis on PAMG, immunological, and stroma components. b Univariate Cox regression Log-Rank P-value representation applying the gradients of master regulators (MR) extracted from the RTN analysis for TCGA-PAAD, and ICGC-PACA-AU Seq datasets. Moreover, the global PDAC phenotype associated to the MR-Gradient (integration of PAMG and immunological MR) was extracted using ICA. ICA2 was detected (r = 0.88; P < 0.0001) and the high contributive genes were represented in a heatmap. c Gene-set enrichment analysis (GSEA) was applied on ICA2, detecting the pathways associated with a favorable and unfavorable prognosis. d MR-Gradient capture both tumor epithelial cell and microenvironment features, previously associated with the prognosis, such as BAILEY_PROGENITOR (NES = 3.18; FDR = 0.0005), BAILEY_SQUAMOUS (NES = −4.11; FDR = 0.004), I_CAF (NES = −2.05; FDR = 0.003), and MOFFITT_ACTIVATED_STROMA (NES = −1.73; FDR = 0.006).

