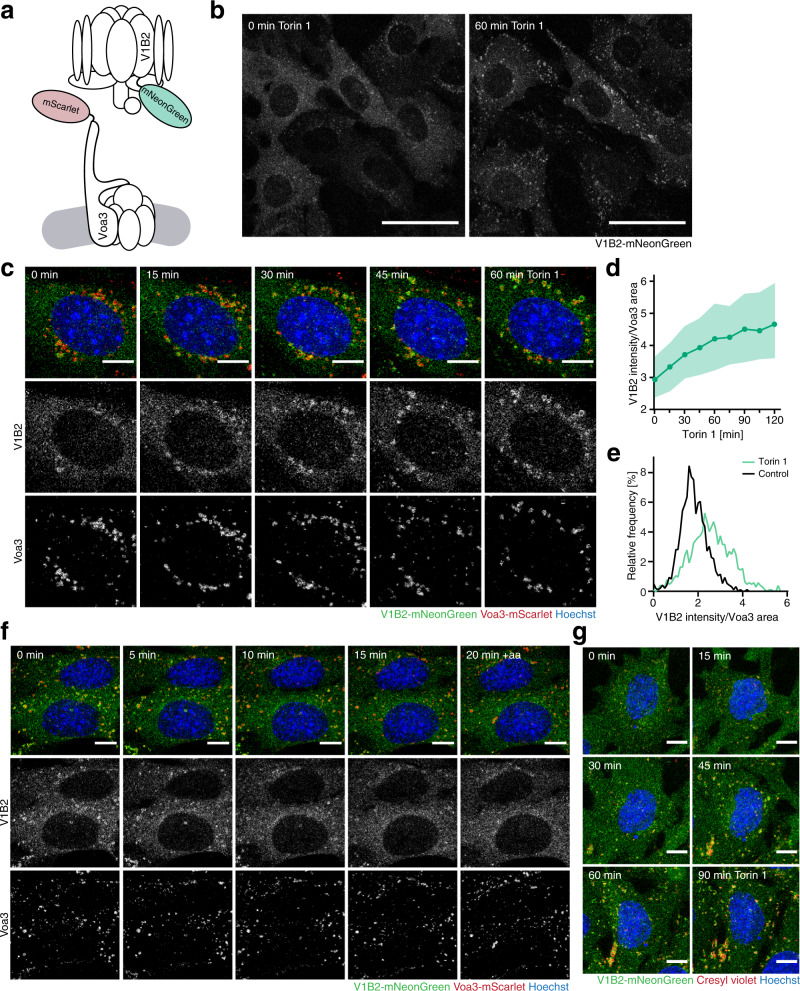
Fig. 4. mTORC1 controls reversible assembly of the V-ATPase at lysosomes.
a Schematic of the live cell imaging assay for lysosomal V-ATPase assembly. b Subcellular localization of V1B2-mNeonGreen before and 60 min after treatment with torin 1 [400 nM]. Scale bars = 50 µm. c Subcellular localization of V1B2-mNeonGreen and Voa3-mScarlet in MEFs over time after addition of torin 1 [400 nM]. Scale bars = 10 µm. d Quantification of V1B2-mNeonGreen recruitment to Voa3-mScarlet-containing lysosomes in cells shown in c. Data are represented as median ± IQR (≥7000 organelles in 12 fields of view with a total of ≥140 cells). e Relative intensity distribution of V1B2-mNeonGreen in Voa3-mScarlet-containing lysosomes before and after 1 h torin 1 in cells shown in c. f Subcellular localization of V1B2-mNeonGreen and Voa3-mScarlet in MEFs over time after 1 h amino acid starvation followed by amino acid restimulation (+aa). Scale bars = 10 µm. g Subcellular localization of V1B2-mNeonGreen and cresyl violet in MEFs over time upon torin 1 treatment [400 nM]. Scale bars = 10 µm. One representative of b, g n = 5, c–f n = 3 biologically independent experiments.

