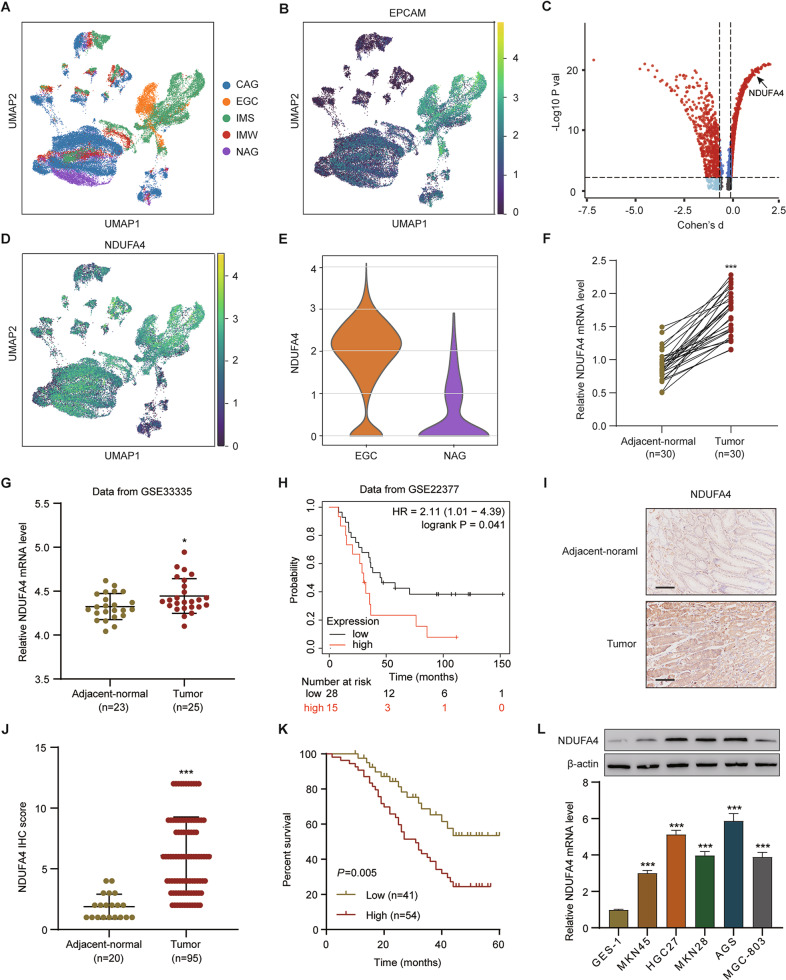
Fig. 1. NDUFA4 was up-regulated in GC and its elevation indicated poor prognosis.
A Uniform Manifold Approximation and Projection (UMAP) plot of patients with non-atrophic gastritis (NAG), chronic atrophic gastritis (CAG), wild intestinal metaplasia (IMW), severe intestinal metaplasia (IMS) and EGC in GSE134520 are denoted by distinct colors. B UMAP plot showed the distribution of epithelial cells in patients with NAG, CAG, IMW, IMS and EGC, marked by the expression of marker gene epithelial cell adhesion molecule (EPCAM) (yellow, high; purple, low). C Differentially expressed genes in epithelial cells between patients with EGC and NAG (the significantly expressed gene, NDUFA4, is highlighted). D UMAP plot of NDUFA4 expression in patients with NAG, CAG, IMW, IMS and EGC (yellow, high; purple, low). E NDUFA4 expressionin epithelial cells between patients with EGC and NAG. F, G NDUFA4 expression in paired gastric and adjacent normal tissues in hospital cohort (F) and GSE33335 dataset (G). H Survival analysis and comparison among people with high and low values of NDUFA4 expression in GSE22377 database. I Representative IHC images and (J) scores of NDUFA4 in GC tissue microarrays. Scale bar: 100 μm. K Survival analysis and comparison among people with high and low expression of NDUFA4 expression in GC tissue microarrays. L The relative mRNA and protein levels of NDUFA4 in various GC cells and normal human gastric epithelium. *P < 0.05, ***P < 0.001 vs adjacent-normal or GES-1.

