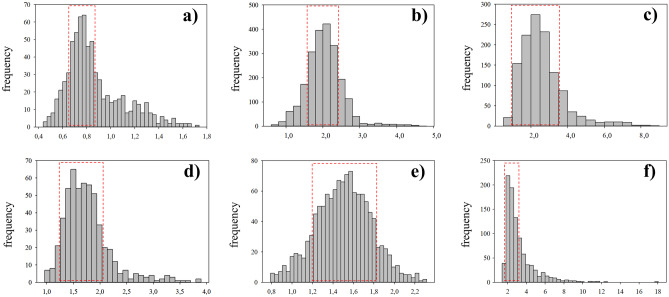
Fig. 4.
Frequency distribution of nuclear DNA contents in different life cycle stages of Saccharina latissima, as measured by DAPI staining and fluorescence microscopy and image analysis, including haploid zoospores (a), haploid male gametophytes (b), haploid female gametophytes (c), diploid early-stage sporophytes (d), and older sporophytes, divided in meristoderm (e) and cortex/medulla cells (f). For each cell type n > 100. For calculation of mean values of the nuclear DNA content, the peak frequency class was identified, and the neighboring frequency classes which presented frequencies above the 50% of that of the peak were included (red squares)

