Fig. 9.

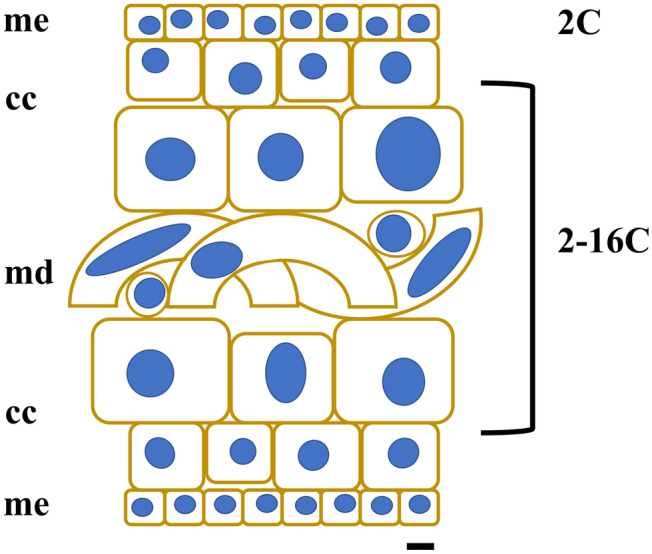
Diagram of a transversal cut of a sporophyte of Saccharina latissima, showing different cell forms and sizes. Meristoderm with small, compact cuboid cells (me), followed by larger cortical cells (cc) with increasing and variable sizes, and an internal medullar section, with large, entangled cells (md). The C-value obtained in the present study for the different tissue cells and a schematic illustration of nucleus sizes is also shown (scale bar is 10 µm)
