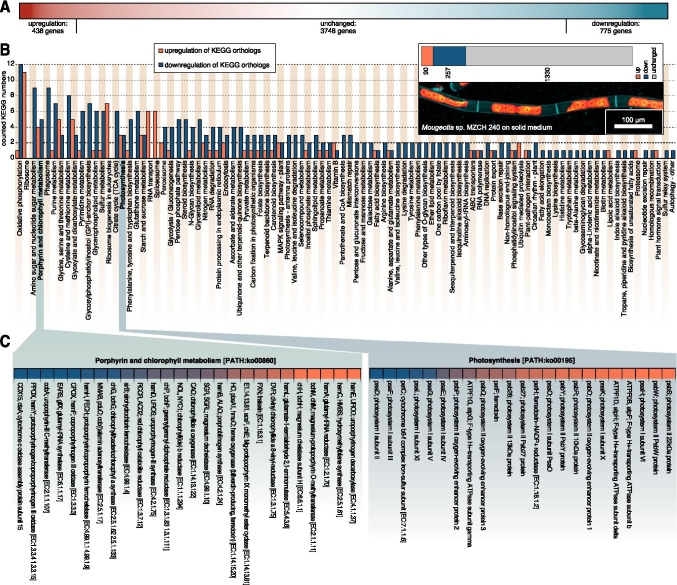
Fig. 1.
Global gene expression patterns in Mougeotia sp. MZCH 240. A Gradient-colored depiction (red up-regulated, white unchanged, and blue downregulated genes) of the differential global gene expression profile of all 4961 genes analysed in this study; the differential responses were obtained by comparing global gene expression of Mougeotia sp. MZCH 240 cultured on solid medium and submerged for 4h versus control (growth on solid medium). B Gene expression pattern of various KEGG orthologs in Mougeotia sp. MZCH 240. Biological replicates (at least triplicates) of gene expression data (TPMTMM-normalized) were summed up and set relative to the control condition data (submergence/control) and then mapped against the Kyoto Encyclopedia of Genes and Genomes (KEGG). An up- or downregulation of a KEGG ortholog was considered if it had a ≥ 2-fold change in gene expression levels. A bar diagram depicts the numbers of all up- (orange) or downregulated (dark blue) KEGG orthologs in the 118 detected KEGG plant pathways in Mougeotia sp. MZCH 240 4h after being submerged (shift) in liquid medium compared to the control culture, which was kept on solid medium. On the upper right side all counted KEGG numbers from up- (90) or down- (257) regulated KEGG orthologs are shown in a stacked bar plot together with 1330 KEGG orthologs with unchanged (grey) gene expression patterns; below is a confocal micrograph of Mougeotia sp. MZCH 240 under control conditions (grown in modified freshwater F/2 with 1% agar 22°C and 120 μmol quanta m-2 s-1)—cell walls were made visible using 1% calcofluor white staining (teal false colored), the plastids are shown in a false-colored red-orange gradient based on their chlorophyll a autofluorescence. C A heatmap of the gene expression patterns in Mougeotia sp. MZCH 240 of the two KEGG plant pathways “Porphyrin and chlorophyll metabolism [PATH:ko00860]” and “Photosynthesis [PATH:ko00195]” in detail. Data is shown as log2 (fold changesubmergence/control) in a color gradient ranging from dark blue (downregulation) to orange (upregulation). Unchanged expression levels are not depicted here

