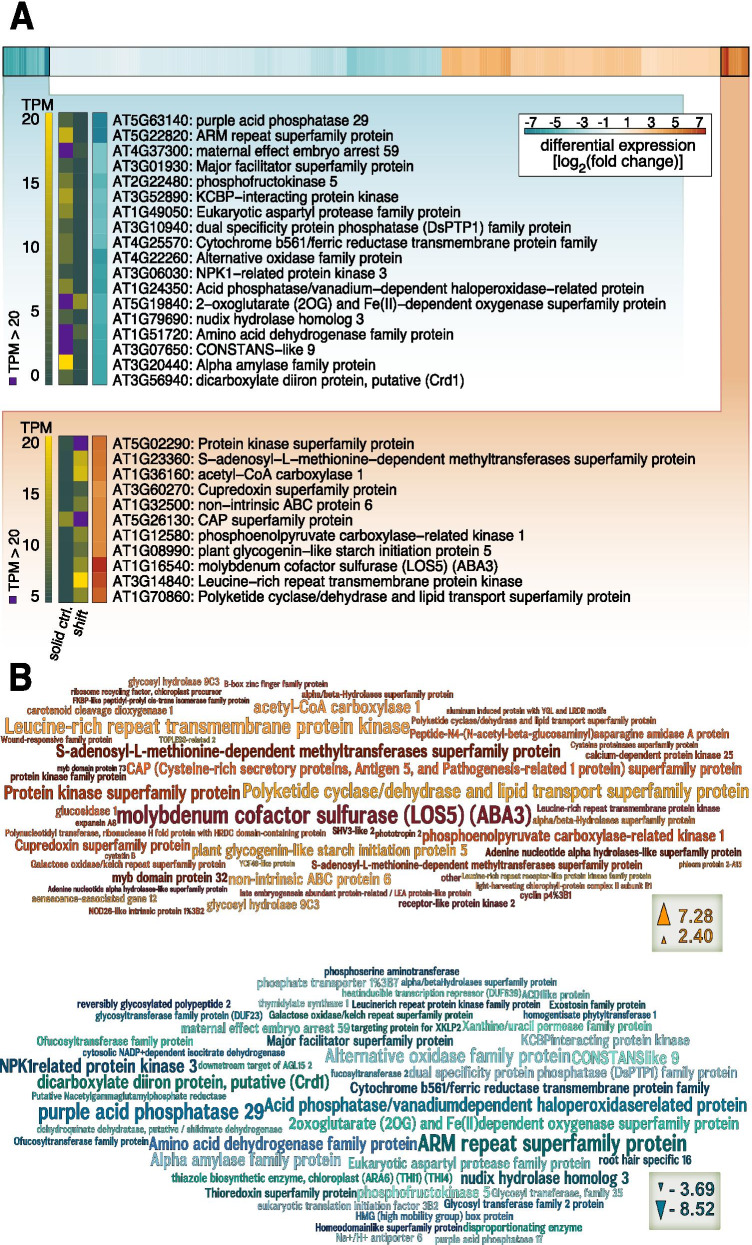
Fig. 4.
Top up-/downregulated genes in Mougeotia sp. MZCH 240 cultured on solid medium and submerged for 4h versus control on solid medium. A A heatmap with all up- (red) or downregulated (blue) genes in Mougeotia sp. MZCH 240 based on edgeR analysis of the RNAseq data. Only genes with a significant (Benjamini-Hochberg corrected p < 0.001) differential change in gene expression of 2-fold (all differential data are shown as log2[fold change submergence/control], calculated using edgeR) were considered. Using the R package pheatmap the data were sorted and log2 values of clusters of genes with the highest/lowest differential gene expression values are shown. The names and descriptions of corresponding Arabidopsis thaliana gene orthologs [prediction based on the reciprocal best BLAST hit (RBBH)] are displayed as well as the corresponding TPM (Transcript per million) values which are shown in a different color gradient (green to yellow). TPM values > 20 are colored in purple; shift = submergence, ctrl. = control. B Word clouds of the top 50 up- (red and orange colors) and top 50 downregulated (blue colors) genes in Mougeotia sp. MZCH 240 generated with Wordle and based on log2(fold change submergence/control), calculated with edgeR. The words represent the names and/or description of Arabidopsis orthologs (prediction based on the RBBH) and the word size corresponds to the differential gene expression change

