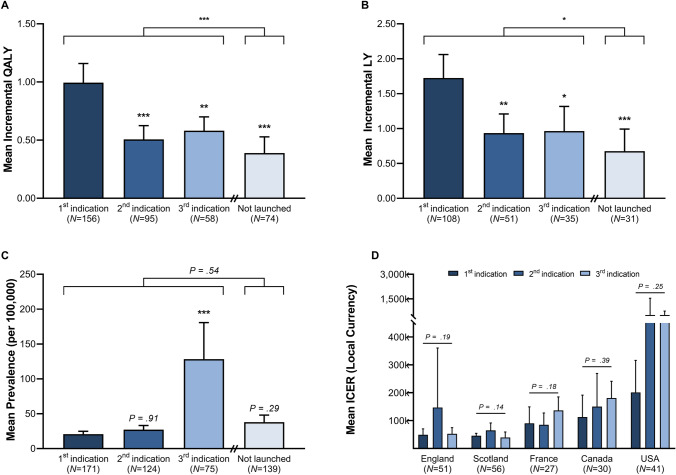
Fig. 3.
Indication characteristics by launch sequence. Average incremental QALYs gained (A), incremental LYs gained (B), disease prevalence (C), and ICERs (D) are compared across indication launch sequence. p values presented on the error bars compare the first to second, first to third, and first to not launch indications. p values on top of the graphs compare launched to not launched indications. p values calculated based on ANOVA with Dunnett’s-test and Student’s t test: *p < 0.05, **p < 0.01, ***p < 0.001. Bars show 95% confidence intervals. ICER incremental cost-effectiveness ratio, LY life year, QALY quality-adjusted life year

