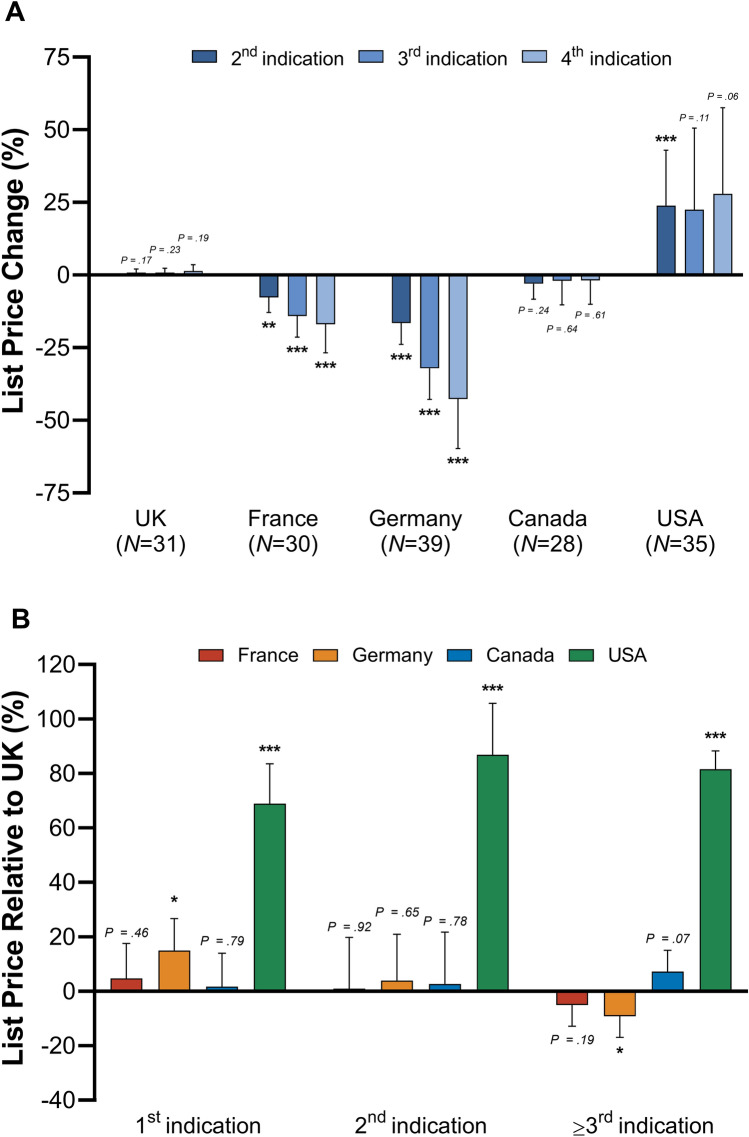
Fig. 4.
Change in drug list prices by indication launch sequence. A illustrates the percentage change of list prices from first to second, first to third, and first to fourth launched indication according to health technology assessment approval date in the UK, France, Germany, Canada, and the USA. B presents list prices relative to UK values for first, second, and subsequently launched indications. Bars show 95% confidence intervals. p values: *p < 0.05, **p < 0.01, ***p < 0.001

