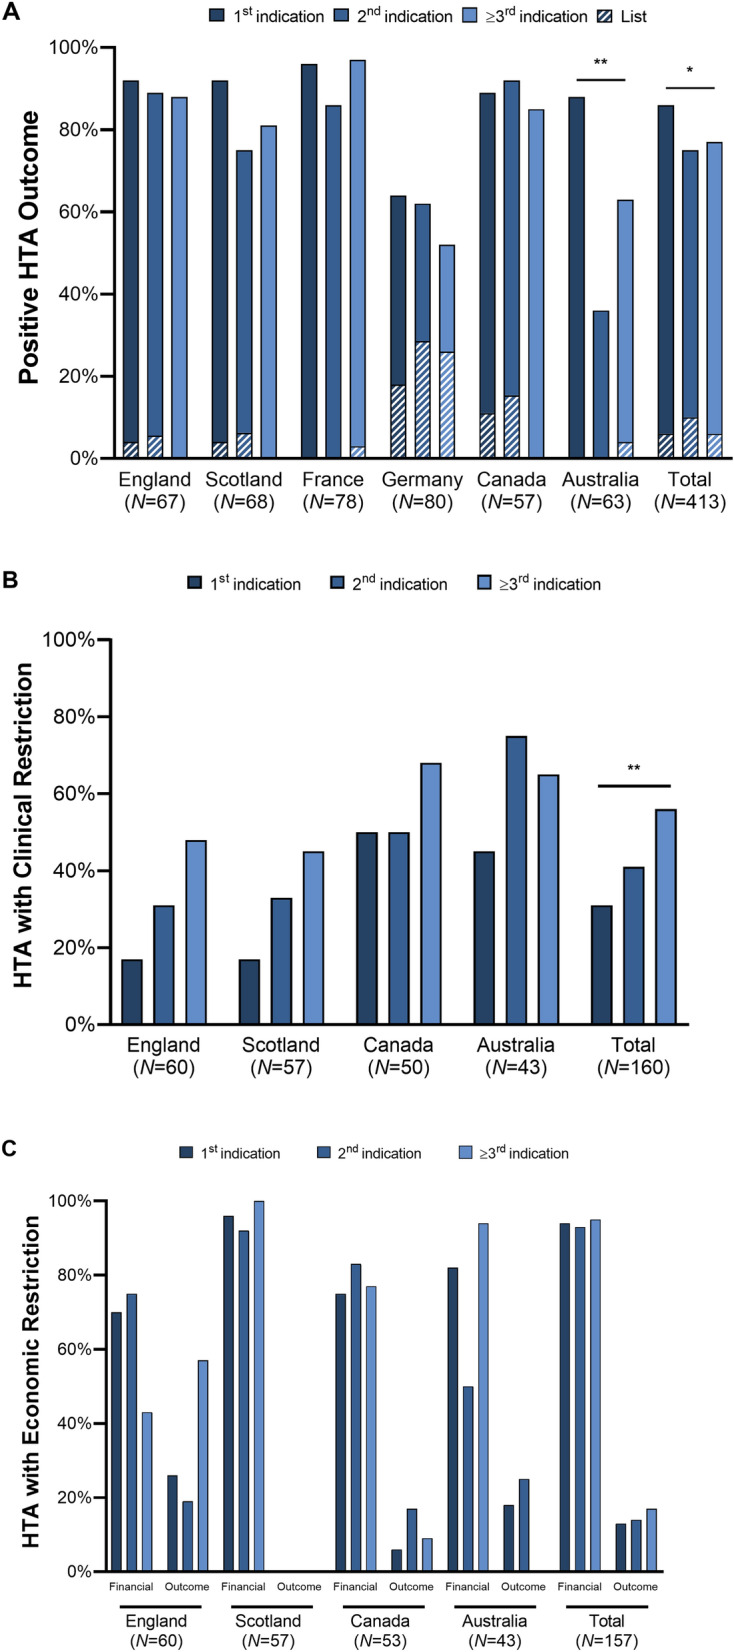
Fig. 5.

HTA outcomes by indication launch sequence. A presents the percentage of positive HTA outcomes across countries. Positive outcomes include “list” and “list with condition”. B shows the percentage of decisions with clinical restrictions in England, Scotland, Canada, and Australia. No restrictions were found in France and Germany. C displays financial and outcome-based managed entry agreements for England, Scotland, Canada, and Australia. Indication launch sequence was determined according to HTA approval date. p values calculated based on χ2-tests: *p < 0.05, **p < 0.01, ***p < 0.001. HTA health technology assessment
