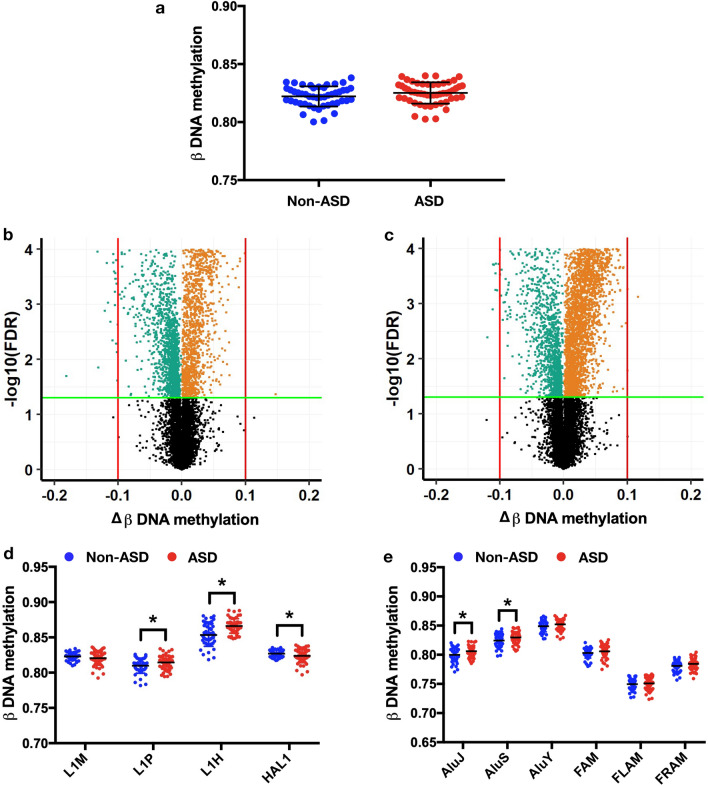
Figure 1.
Methylation of repetitive elements (LINE-1 and Alu) in non-ASD (n = 48) and ASD (n = 52). Total methylation of REs (a). Volcano plots of mean change in methylation (Δβ) of LINE-1 (b) and Alu (c) against − log10 FDR-adjusted p value (PFDR) of ASD compared with non-ASD; the green line represents PFDR = 0.05, the red line represents 10% of methylation changes, green dots represent hypomethylation loci, and orange dots represent hypermethylation loci. Changes in DNA methylation (Δβ) of ASD compared with non-ASD by a subfamily of LINE-1 (d) and Alu (e). Mean ± SD. *p < 0.05.

