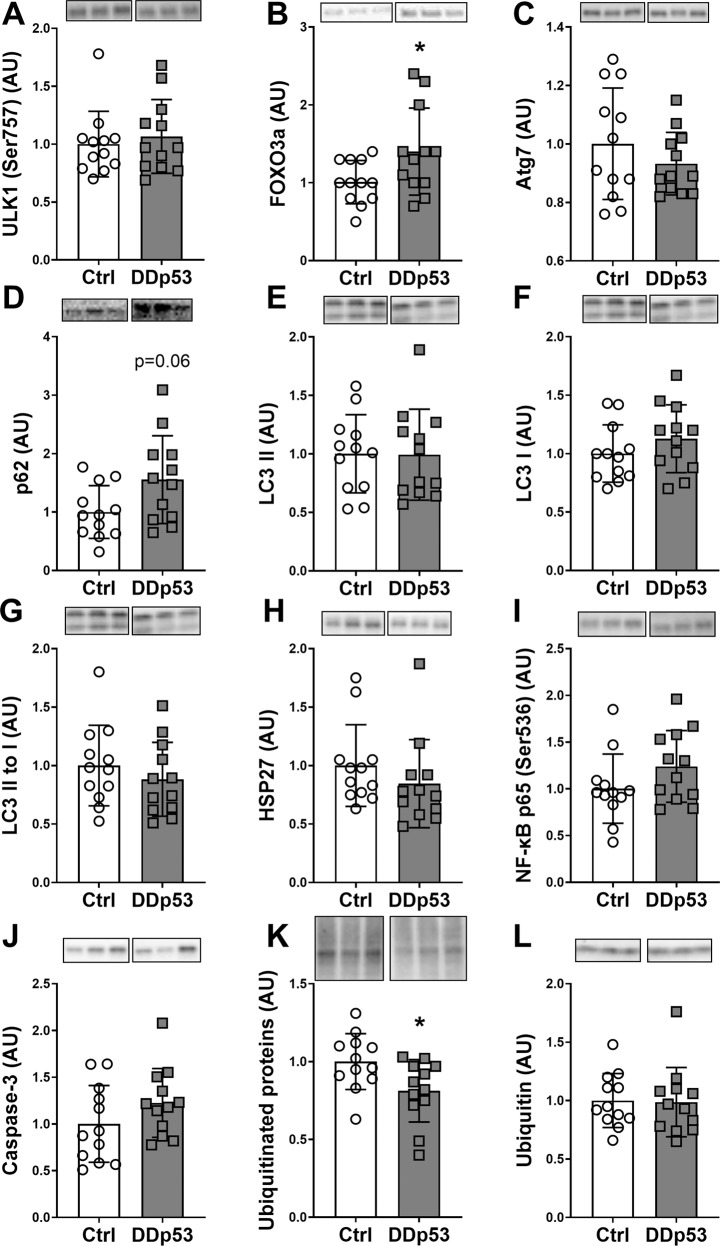
Fig. 6. Degradation, inflammation, and cell death after DDp53 overexpression.
A Phospho-ULK1 (Ser757) was unchanged following DDp53 electroporation. B Total FOXO3a protein levels were increased in the electroporated DDp53 tibialis anterior muscle compared to the control. C Atg7 was unchanged between both sides. D Autophagy substrate p62 trended to be increased in the DDp53 leg compared to the control side. E–G LC3 I, II and the LC3 II to I ratio was not significantly different at three weeks of DDp53 overexpression. H HSP27 was not different between the legs. I Phospho-p65 (Ser536) was not different between the DDp53 and the control leg. J Caspase-3 levels were unchanged. K Total ubiquitinated protein levels were lower after DDp53 overexpression compared to the contralateral control muscle. L Free ubiquitin levels were not different between the DDp53 and the control tibialis anterior muscle. Individual data points represent individual animals. Squares represent the leg electroporated with DDp53, circles the contralateral control leg of the same animals. Western blot images show three representative bands from each condition. Both representative pictures stem from the same membrane and exposure time. All western blots were normalized to total protein per lane. Original, unaltered images of all membranes and the gels that they were normalized to can be found in the data supplement. n = 12, * indicates a p-value of <0.05.

