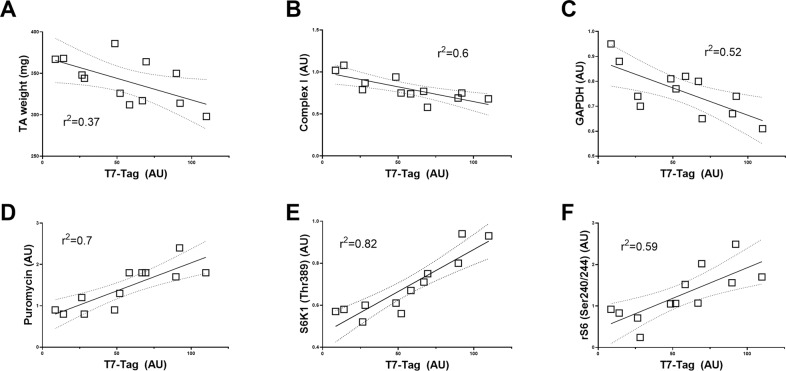
Fig. 8. Linear regression analysis between T7-tag protein levels, skeletal muscle phenotype, and the regulation of muscle protein synthesis- and degradation in DDp53 overexpressing tibialis anterior muscle.
A Muscle mass, B Mitochondrial complex I protein, and C GAPDH in the DDp53 electroporated leg correlate inversely with DDp53 protein levels. In contrast, D muscle protein synthesis via puromycin, E mTORC1 activity (phospho-S6K1 (Thr389) levels), and F S6K1 activity (phospho-rS6 (Ser240/244) levels) are positively associated with DDp53.

