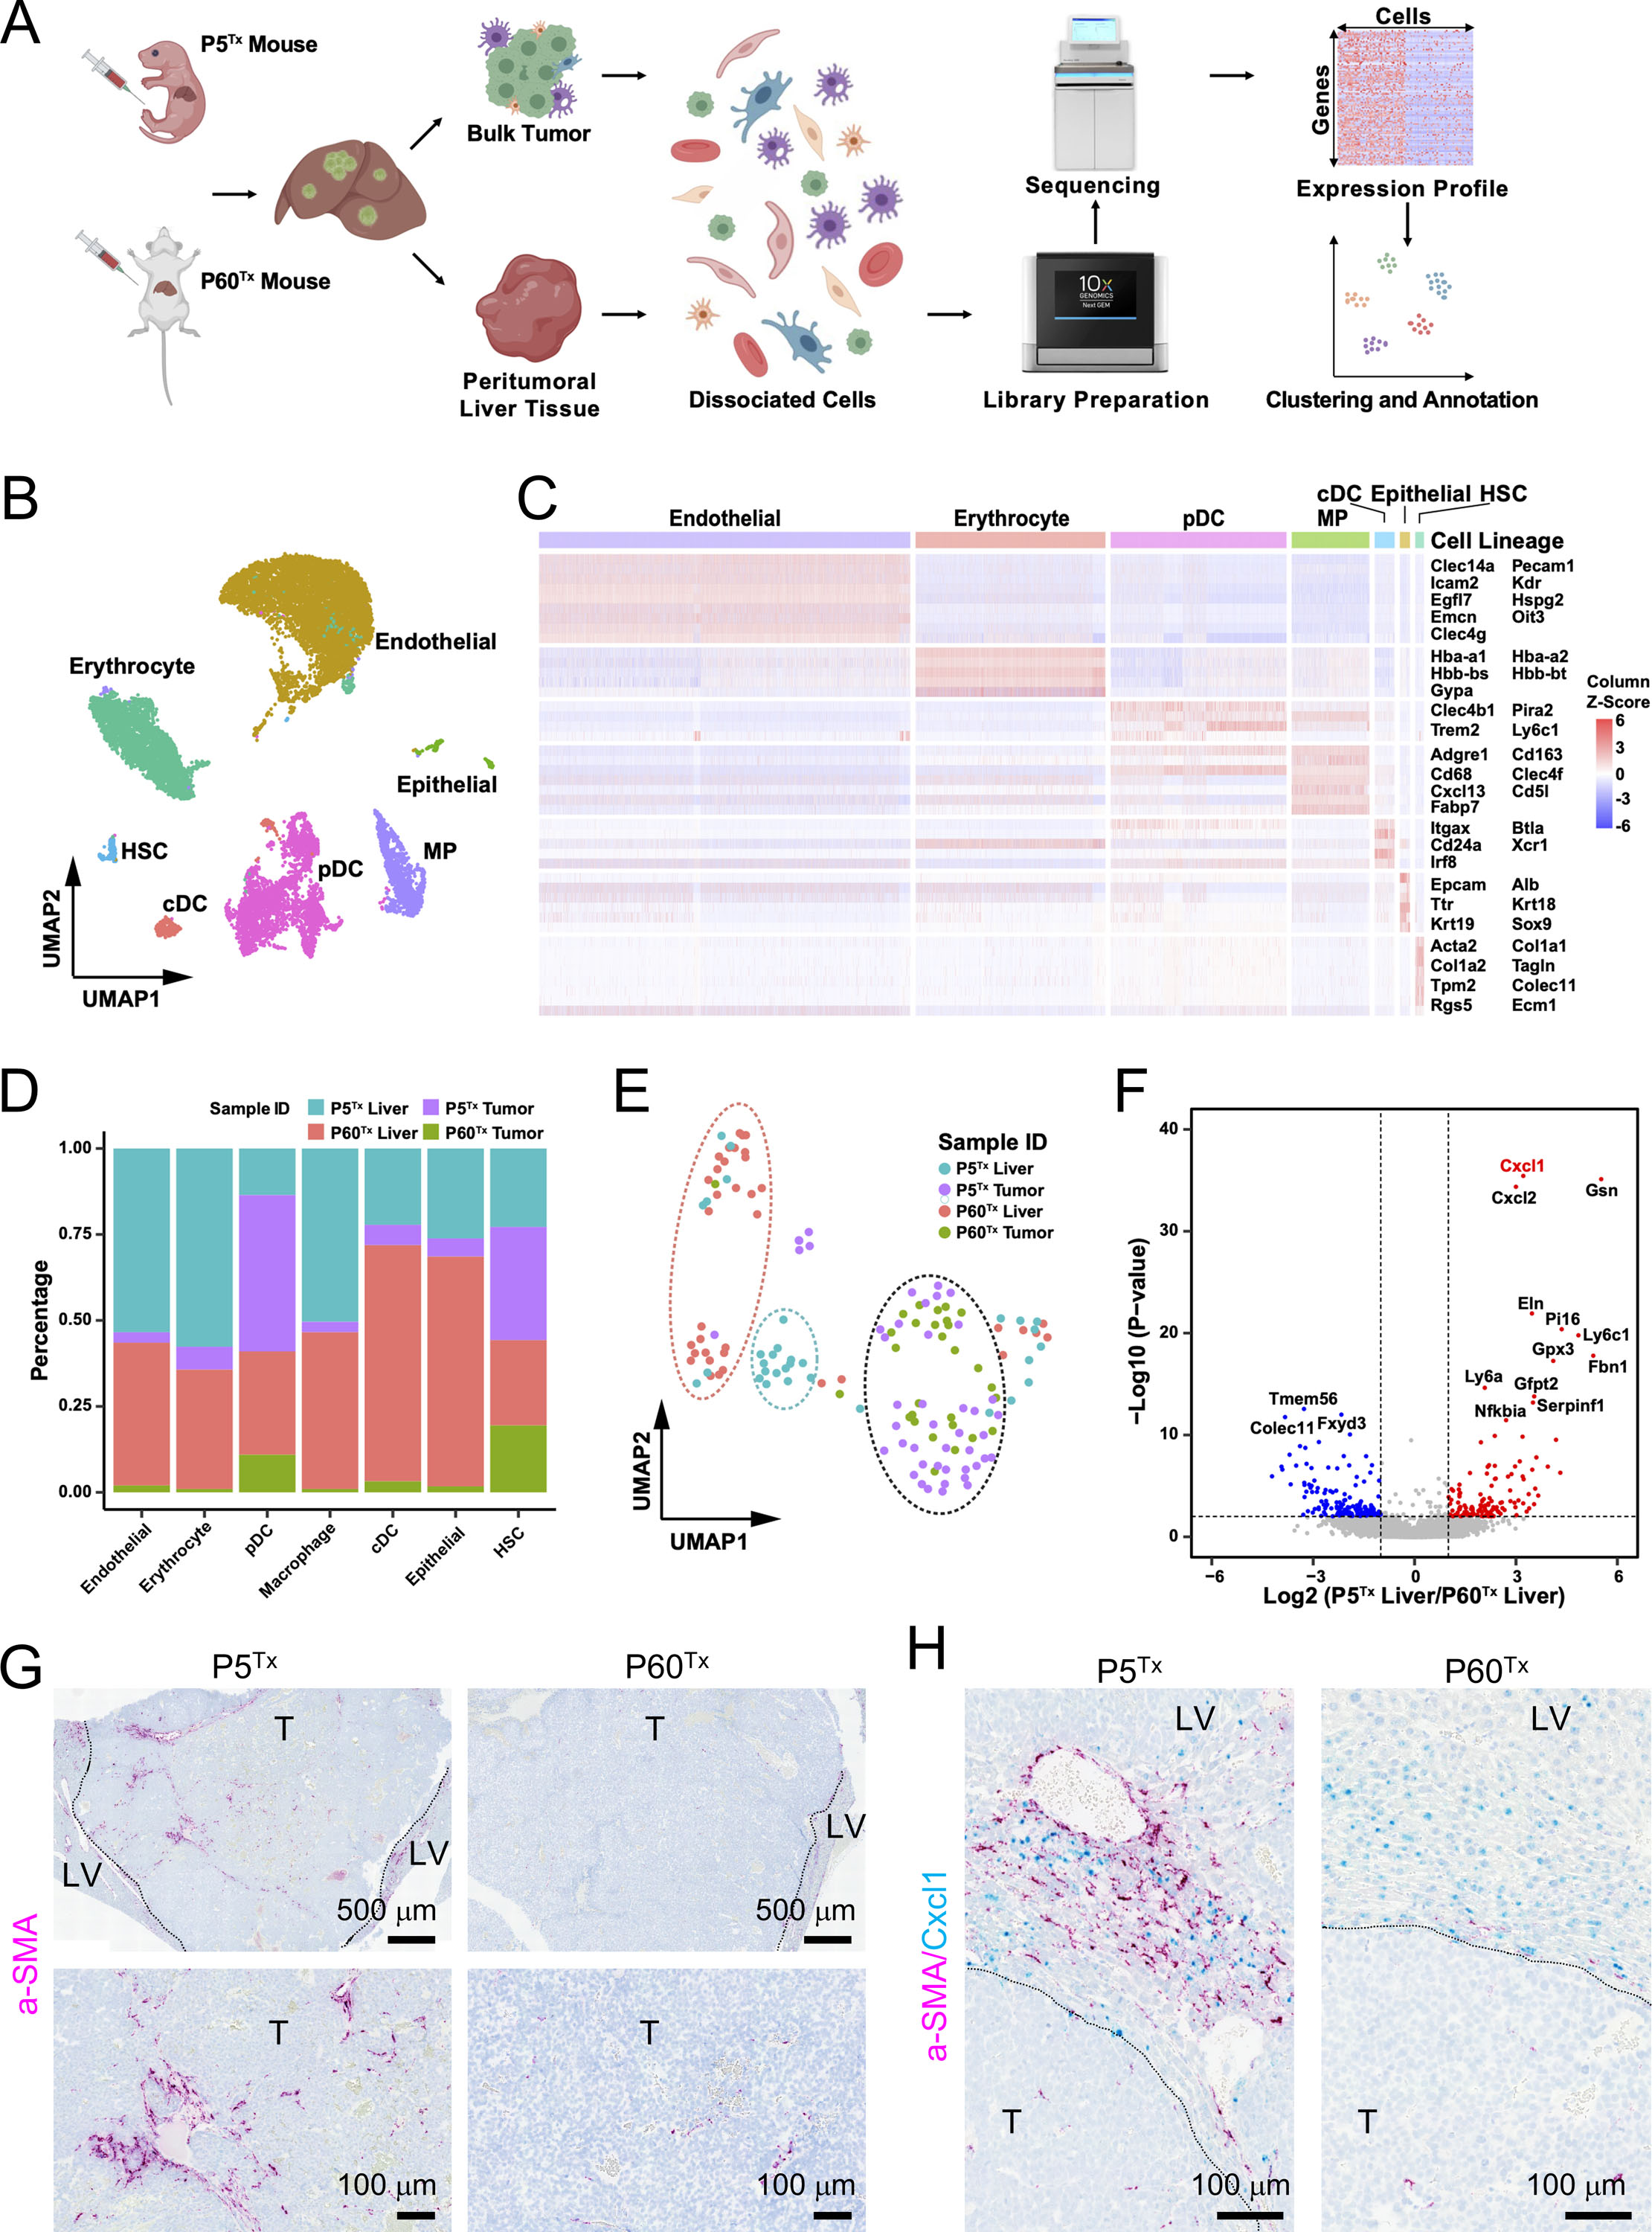
Figure 2. A scRNA-seq transcriptomics comparison of the tumor and liver tissues from the HepG2 models reveals a significant difference between the P5Tx and P60Tx peritumoral aHSCs.

(A) The schematic illustrating the experimental design, single cell isolation, sequencing, and analysis.
(B) Cell type annotation by the expression of marker gene signatures. HSC, hepatic stellate cell; cDC, conventional dendritic cell; pDC, plasmacytoid dendritic cell; MP, macrophage.
(C) Heatmap showing the expression of marker gene signatures of each hepatic cell type. The columns denote cells, and the rows denote genes.
(D) Bar plot showing the proportion of cells from the indicated sample sources across seven hepatic cell types.
(E) UMAP illustration of the HSC clustering across the four indicated sample sources. The dashed ovals represent the main HSC clusters.
(F) Volcano plot of differential expression analysis of the peritumoral HSCs from the P5Tx and P60Tx samples. Red dots indicate genes up-regulated in the P5Tx liver HSCs and the blue dots indicate genes up-regulated in the P60Tx liver HSCs. P-value <0.01 coupled with a Fold Change >2 or <0.5 were used to define the significantly differentially expressed genes.
(G) RNAscope ISH of αSMA on the P5Tx and P60Tx tumors. Magenta: αSMA signal; blue: hematoxylin counterstain. Dashed line: tumor border. T: tumor; LV: liver. Scale bars as indicated.
(H) Dual RNAscope ISH of αSMA/Cxcl1 on the P5Tx and P60Tx tumors. Magenta: αSMA signal; cyan: Cxc11 signal, blue: hematoxylin counterstain. Scale bars as indicated.
