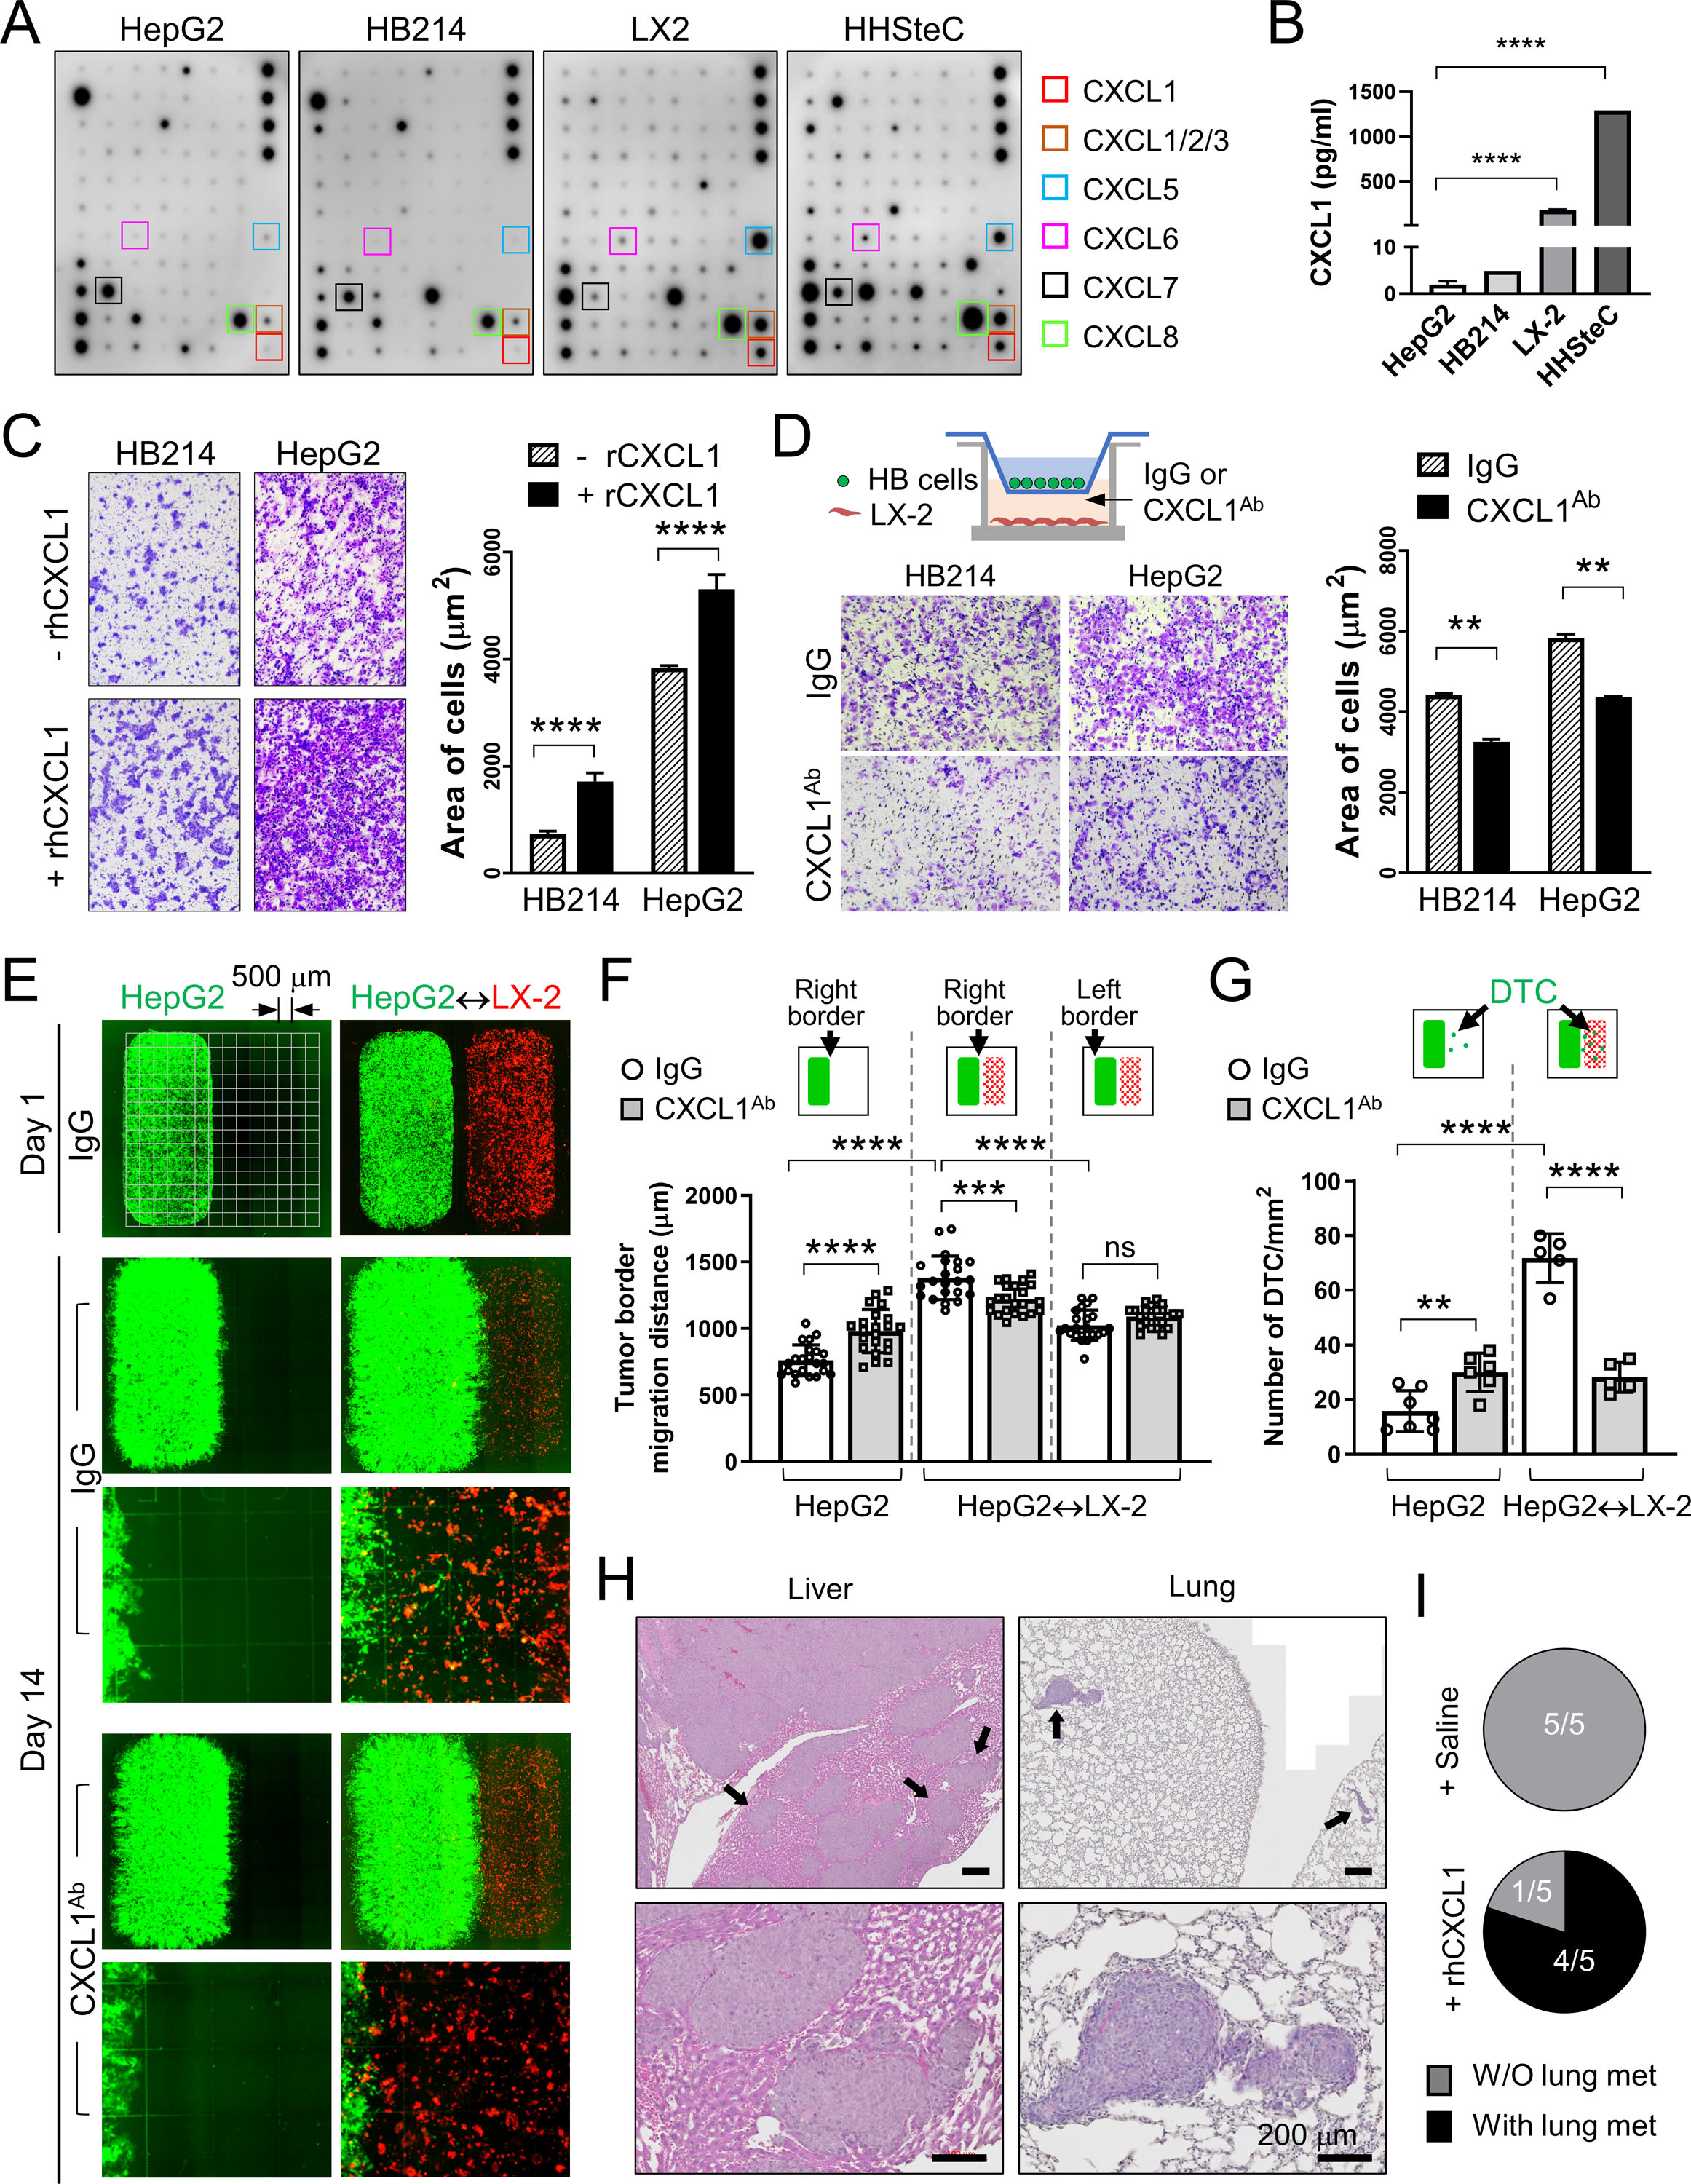
Figure 4. Peritumoral aHSCs promotes HB cell migration and dissemination in a CXCL1-dependent manner in vitro and in vivo.

(A) Cytokine array assay using the CM from the indicated cells. Boxes: CXCR2 ligands.
(B) CXCL1 Elisa using the CM from the indicated cells.
(C) Images and quantification of the transwell migration assay of the HB214 and HepG2 cells pretreated with or without rhCXCL1.
(D) Images and quantification of the transwell migration assay of the HB214 and HepG2 cells as indicated in the top diagram. LX-2 was cultured in the bottom chamber with IgG or CXCL1Ab added in the medium. Number of cells/μm2 were counted and compared.
(E) Day 1 and Day 14 GFP/RFP fluorescence images of the two-well cocultures of GFP+ HepG2 and RFP+ LX-2. HepG2 was placed in the left well with or without RFP+ LX-2 in the right chamber, and treated with IgG or CXCL1Ab. Culture slides with an imprinted 500-µm grid were used as indicated in the top left image.
(F) Comparison of the HepG2 migration distance on the indicated border from Day 1 to Day 14 in (E) measured by using the 500-µm grid.
(G) Comparison of the number of disseminated HepG2 cells/mm2 in the indicated conditions.
(H) H&E images of the liver and lung of the P60Tx model treated with rhCXCL1. Arrows: metastases I the liver and lung. All scale bars are 200 μm.
(I) Pie charts showing the number of animals with or without lung metastasis in the saline- or rhCXCL1-treated P60Tx model.
All P-values were calculated by unpaired two-tailed t-test: ns, not significant, ** <0.01; *** <0.001; ****<0.0001.
