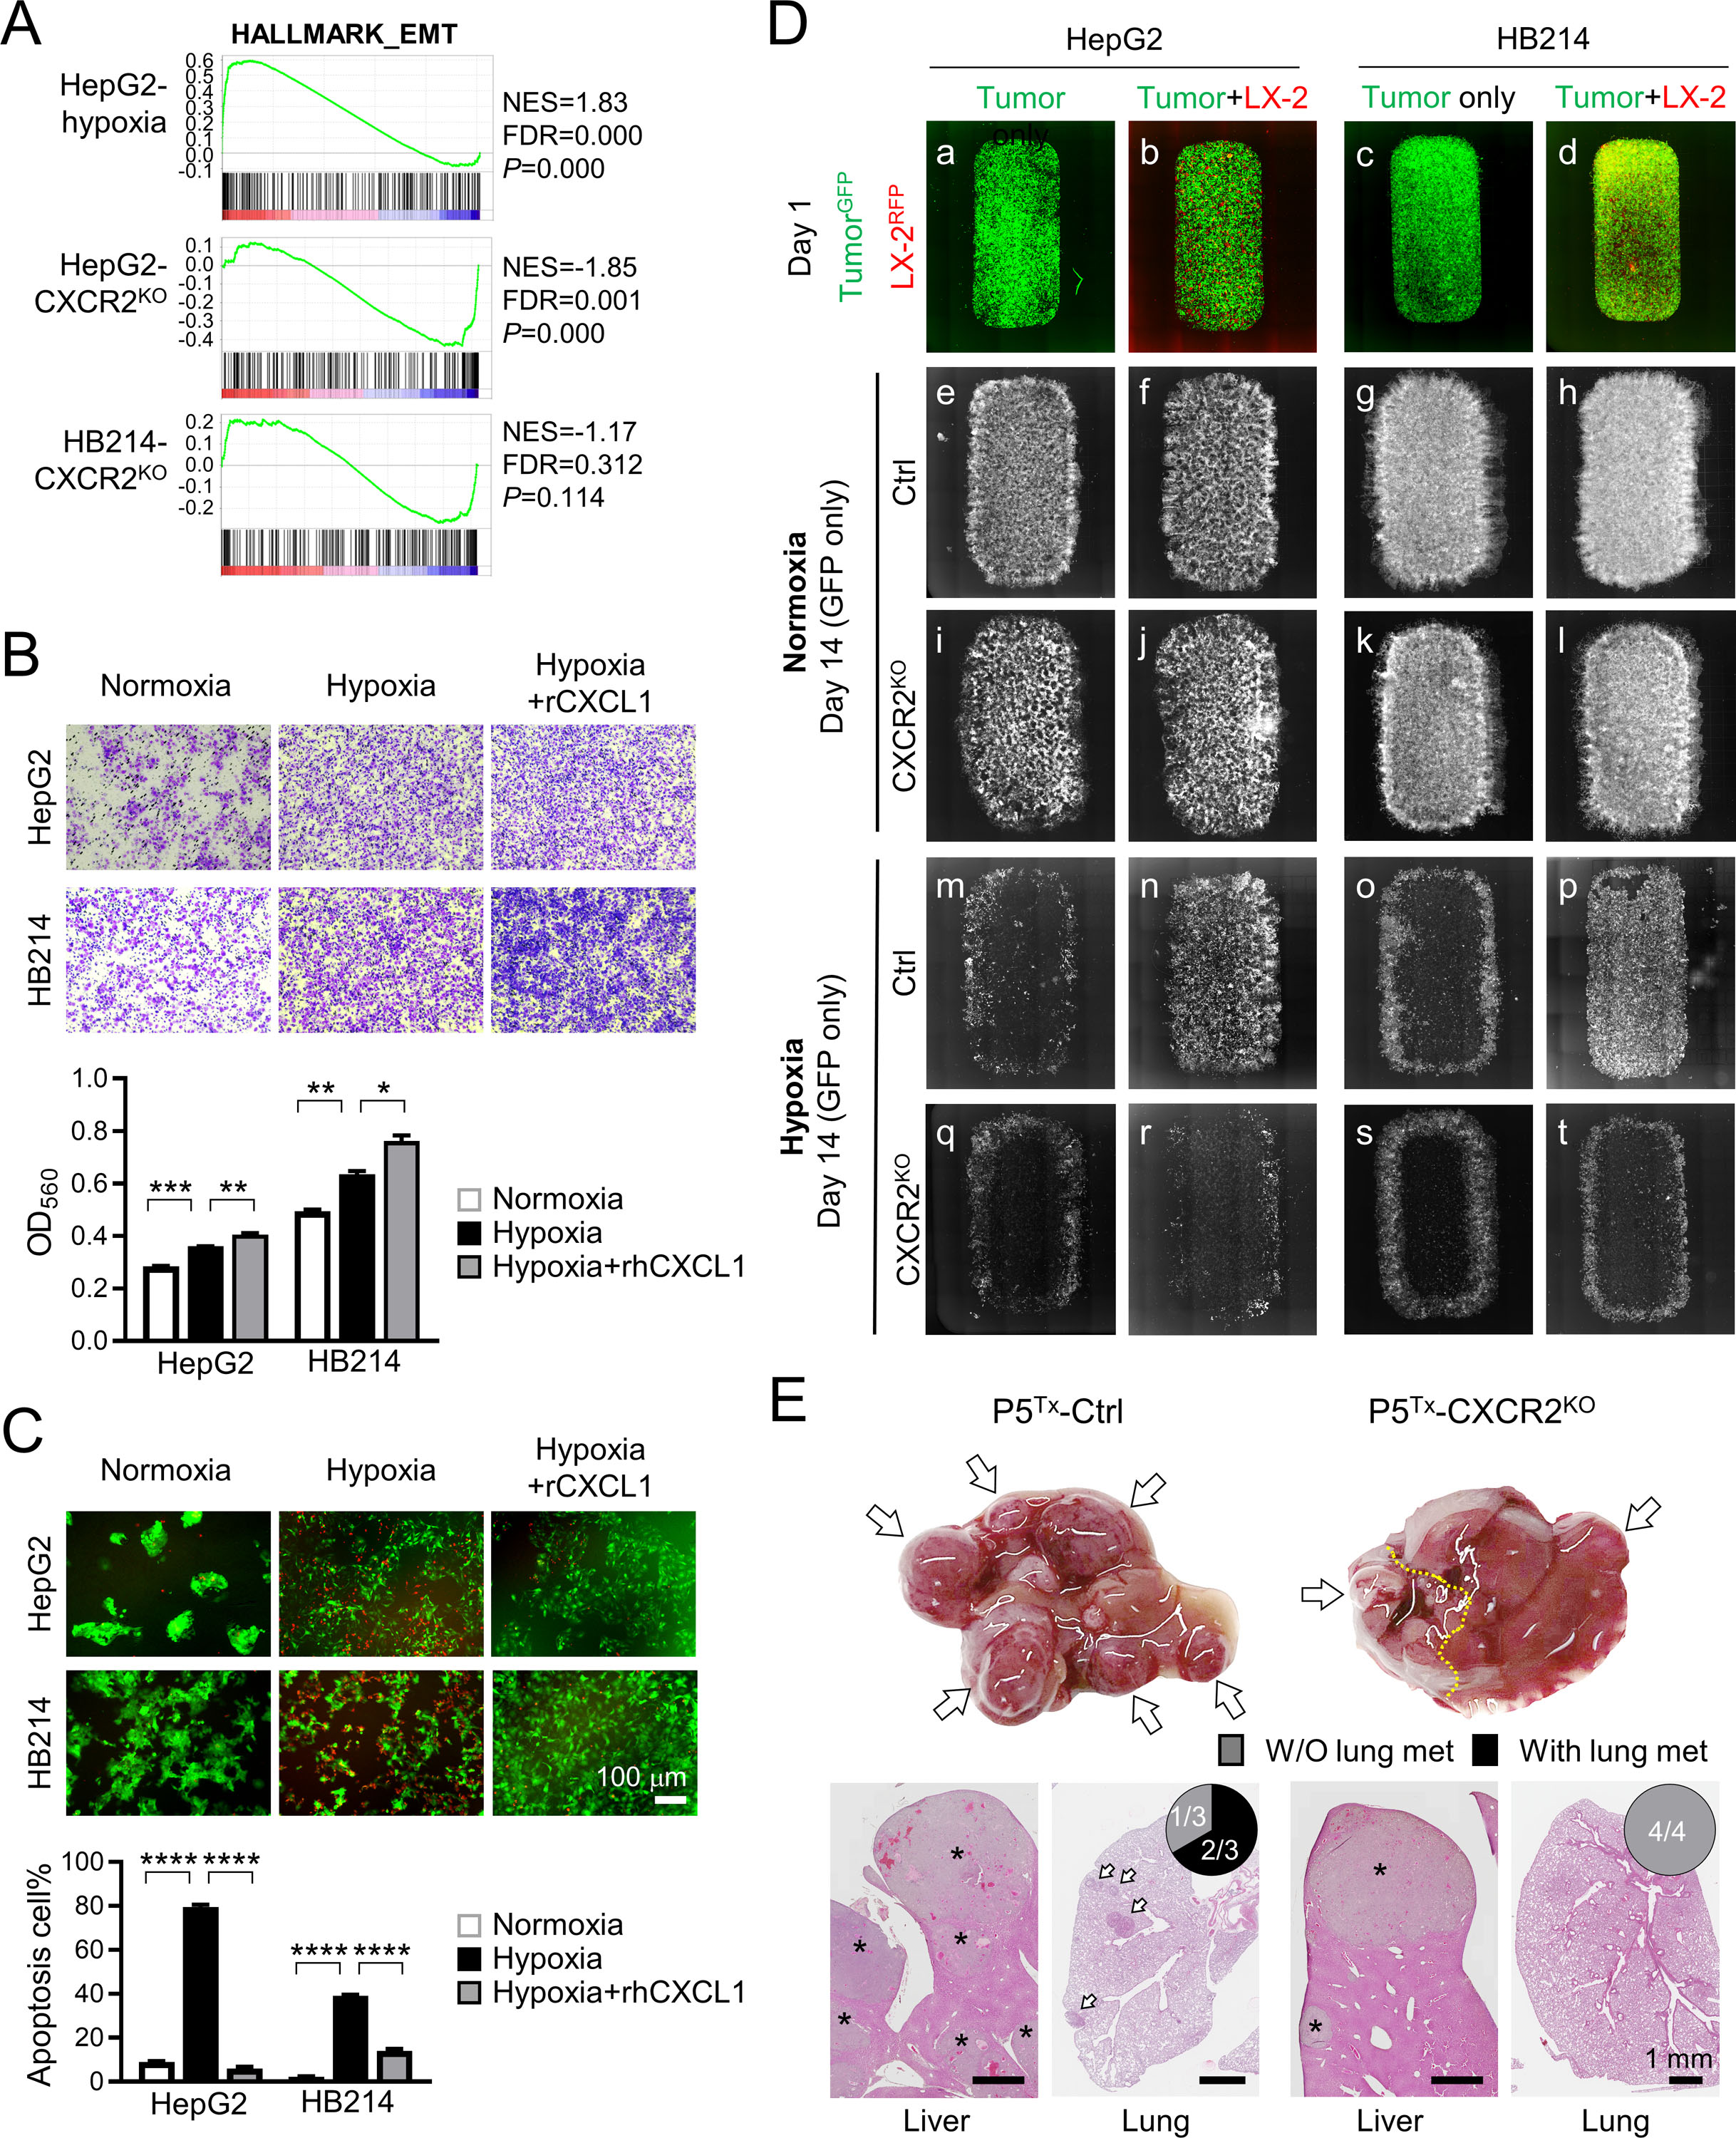
Figure 6. CXCL1/CXCR2 axis is essential to HB cell migration and survival under hypoxia.

(A) GSEA of HALLMARK_EMT gene set by comparing the RNAseq profiles of the indicated cells with their control cells.
(B) Transwell migration assay of the HepG2 and HB214 cells cultured under hypoxia.
(C) Images and comparison of Caspase-3 apoptosis assay of the HepG2 and HB214 cells cultured under the indicated conditions. Apoptotic cells were labeled by NucView 530 RFP fluorescence. P-values were calculated by unpaired two-tailed t-test.
(D) Day 1 and Day 14 fluorescence images of the GFP+ HepG2 and HB214 cocultured with or without RFP+ LX-2 under normoxia and hypoxia. Day 1 images are merged GFP/RFP and Day 14 images are GFP only.
(E) Liver gross images (top) and H&E images of the liver and lung (bottom) of the P5Tx model transplanted with control or CXCR2KO HepG2 cells. * tumors in the liver; arrows: lung metastases. Pie charts indicate the incidence of lung metastasis. All scale bars are 1 mm.
