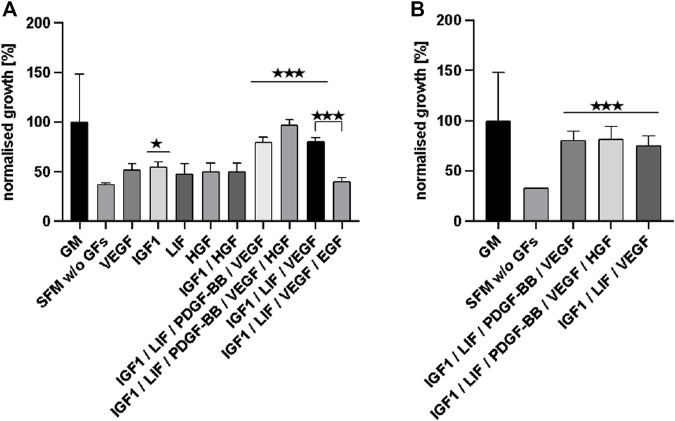
FIGURE 4.
(A) displays the effects that significant growth factors and growth factor combinations had on cell growth (according to JMP analysis) in comparison to SFM w/o additional GFs (apart from FGF-2). Data is normalised as % of growth compared to the control (GM). The three most effective growth factor combinations were tested again and the results are shown in (B).

