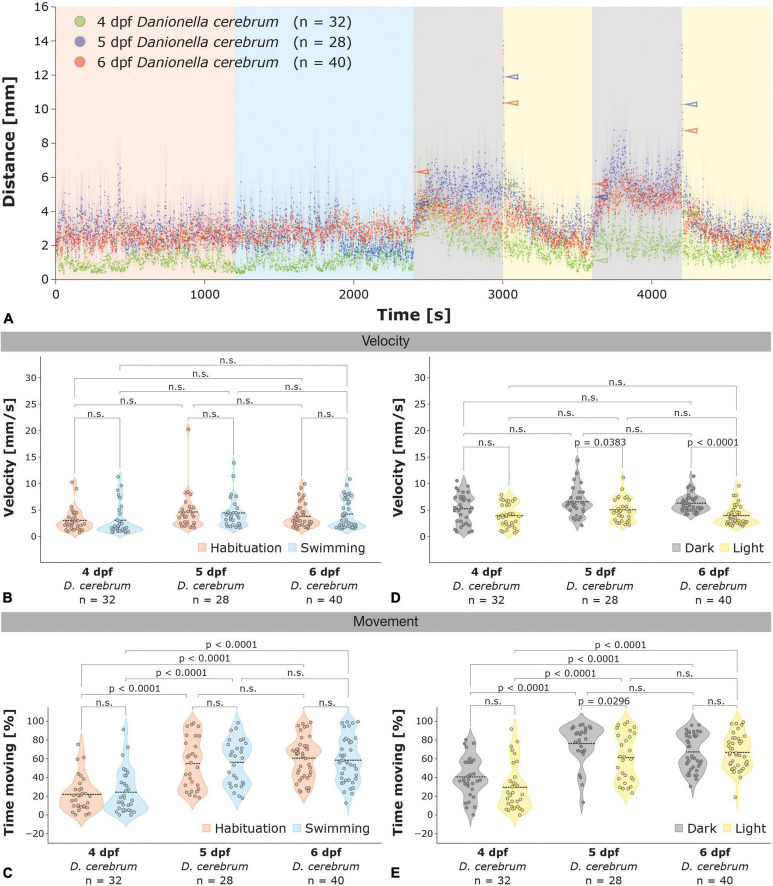
FIGURE 3.
Locomotor activity of 4–6 dpf Dc larvae in the light-dark test. (A) Locomotor activity of 4 dpf (green; n = 32), 5 dpf (blue; n = 28), and 6 dpf (red; n = 40) Dc larvae in the light-dark test; color-coded arrowheads highlight the increases in locomotor activity 1 s after the illumination switch. (B,C) Violin plots of the velocity during movement (B) and the time spent moving (C) for 4–6 dpf Dc larvae in the habituation (red) and swimming (blue) phase. (D,E) Violin plots of the velocity during movement (D) and the time spent moving (E) for 4–6 dpf Dc larvae in the light (yellow) and dark (gray) phases. Note the reduced movement of 4 dpf (C,E) and the lack of increase in velocity during the dark phases (A,D) relative to 5 and 6 dpf Dc larvae. Two-way ANOVA followed by Šídák’s or Tukey’s multiple comparisons test was used to analyze differences in velocity or movement between phases of the light-dark test in and between 4 and 6 dpf Dc; p > 0.05 is abbreviated as not significant (n.s.).

