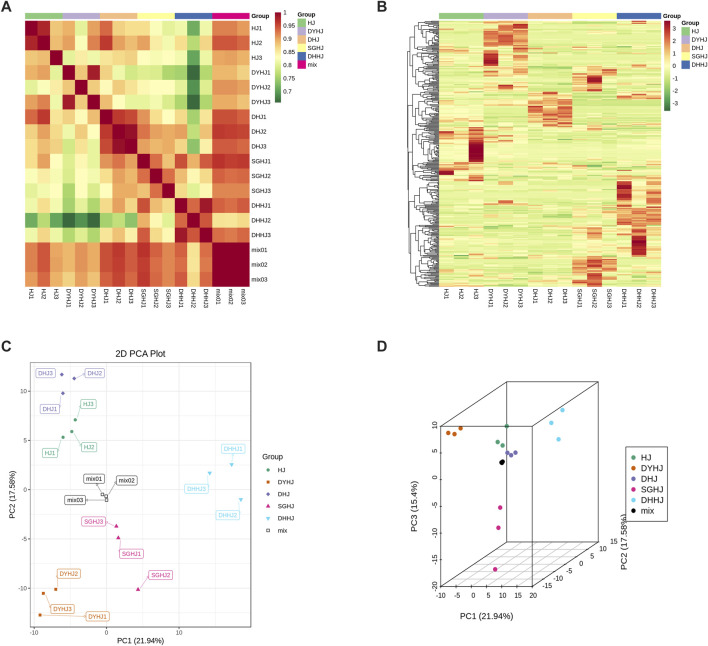
FIGURE 2.
(A) Correlation of all the samples. The correlation analysis between the samples was used to estimate the biological duplication among samples within a group. The closer R2 is to 1, the stronger the correlation between the two repeated samples. (B) Clustering heat-map of metabolites of all the samples. The upregulated and downregulated metabolites were expressed with different shade colors of red and green, respectively. With the increase in the abundance value, the color of the bar changed from green to red. When the abundance value was 0, the color of the bar was white, as shown in the bar at the upper right. (C) Differential metabolites analysis on the basis of principal component analysis (PCA). (D) PCA 3D plots.

