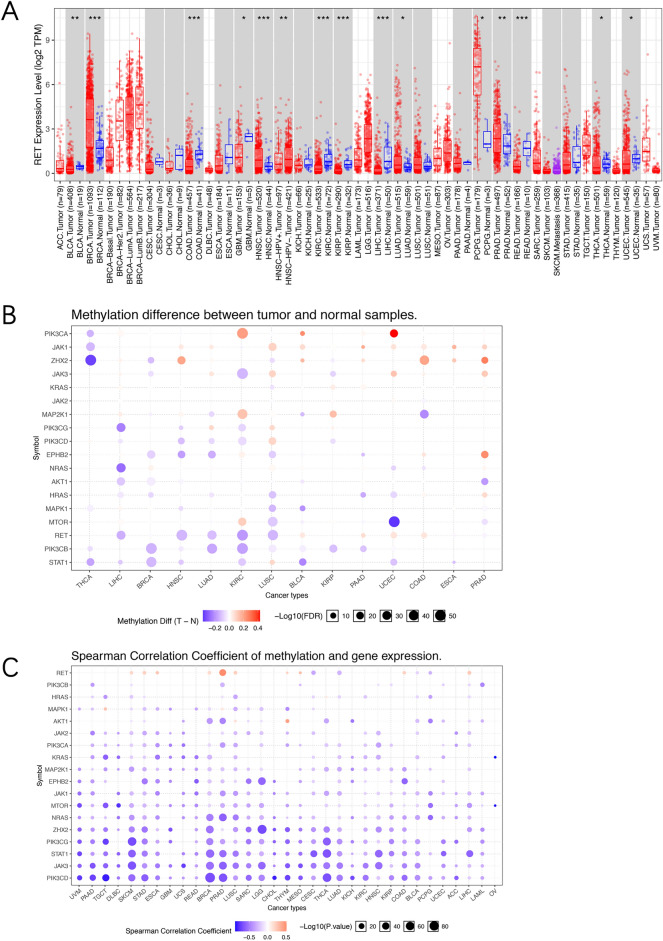
Figure 8.
RET mRNA levels and methylation in TCGA cancers. (A) RET mRNA levels (log2 TPM transformed) between tumor tissues and the paired normal tissues among diverse TCGA cancers from TIMER2. (B) Bubble map illustrating the differences of RET and related downstream genes methylation between tumor tissues and corresponding normal tissues among cancers. Red dot: the upregulation of methylation in indicated cancers, blue dot: the downregulation of methylation in indicated cancers. (C) Bubble map depicting the relation between methylation and RET and its downstream genes expression in different TCGA cancers. Red dot: the increases in both methylation level and gene expression level, blue dot: the increase in methylation level but decrease in gene expression level. TPM transcripts per million. *p < 0.05, **p < 0.01, ***p < 0.001.

