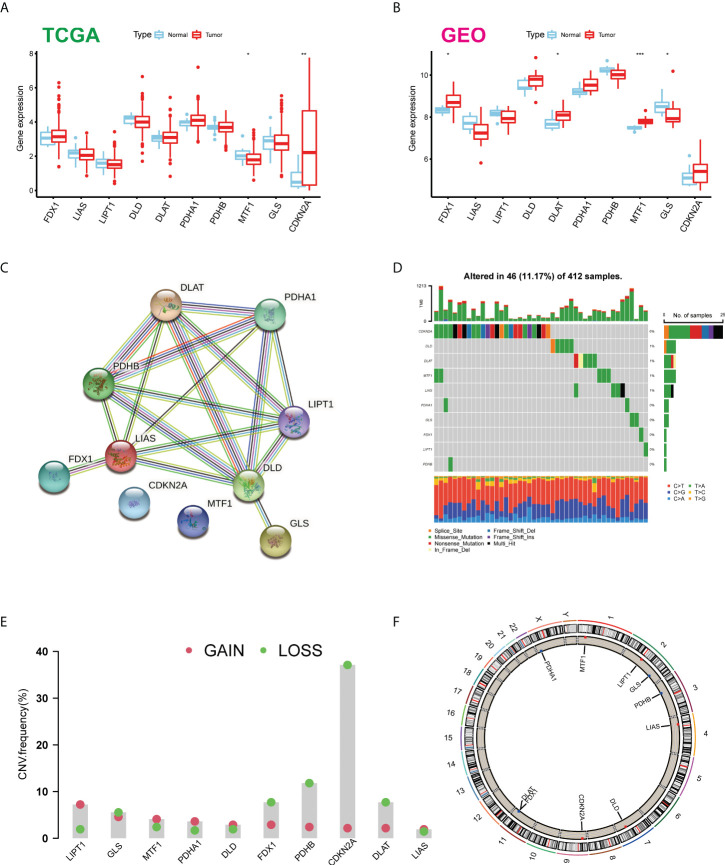
Figure 1.
Expression distributions and genetic mutational landscape of CUGs in BLCA. Expression distributions of 10 CUGs between BLCA and normal tissues in the (A) TCGA-BLCA and (B) GSE166716 datasets. (C) The PPI network acquired from the STRING database among the CUGs. (D) Genetic alteration on a query of CUGs. (E) Frequencies of CNV gain, loss, and non-CNV among CUGs. (F) Circus plots of chromosome distributions of CUGs (*p < 0.05; **p < 0.01; ***p < 0.001). CUGs, cuproptosis-related genes; BLCA, bladder cancer; TCGA, The Cancer Genome Atlas; PPI, protein–protein interaction.

