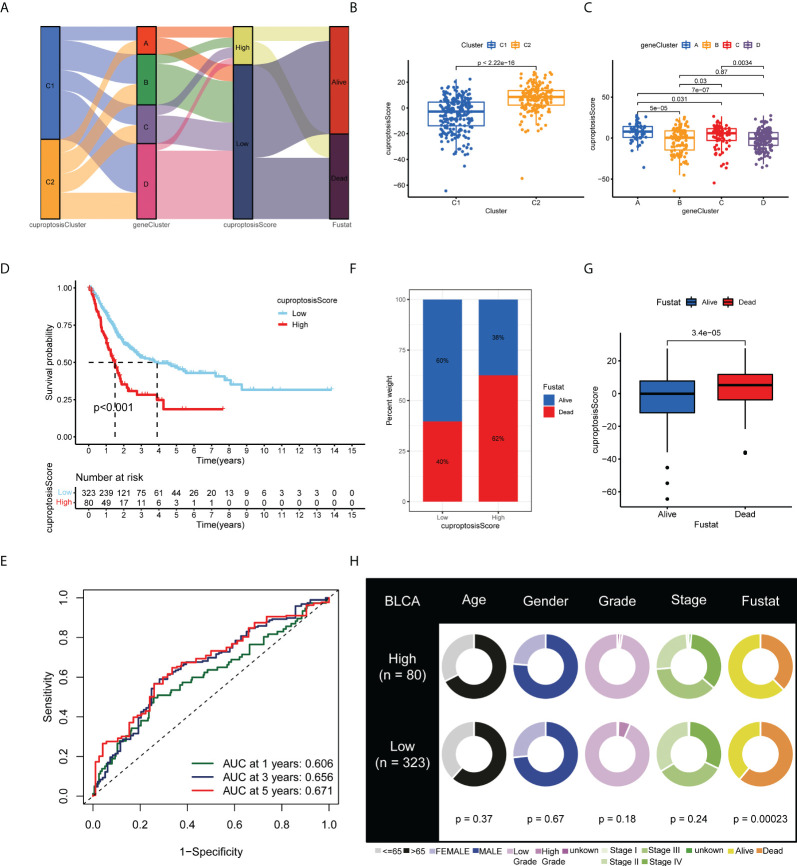
Figure 5.
Development and validation of the cuproptosis scoring system for BLCA. (A) Alluvial diagram of two cuproptosis subtypes, four gene clusters, cuproptosis scores, and clinical outcomes. Differences in cuproptosis score between (B) the two cuproptosis subtypes and (C) the four gene clusters. (D) Kaplan–Meier analysis of the OS between the two cuproptosis score groups. (E) ROC curves to predict the sensitivity and specificity of 1-, 3-, and 5-year survival according to the cuproptosis score. (F) Histogram and (G) boxplot depict the distribution of survival status of BLCA patients in the two groups. (H) Clinical characteristics for the high and low cuproptosis score groups. BLCA, bladder cancer; OS, overall survival; ROC, receiver operating characteristic.

