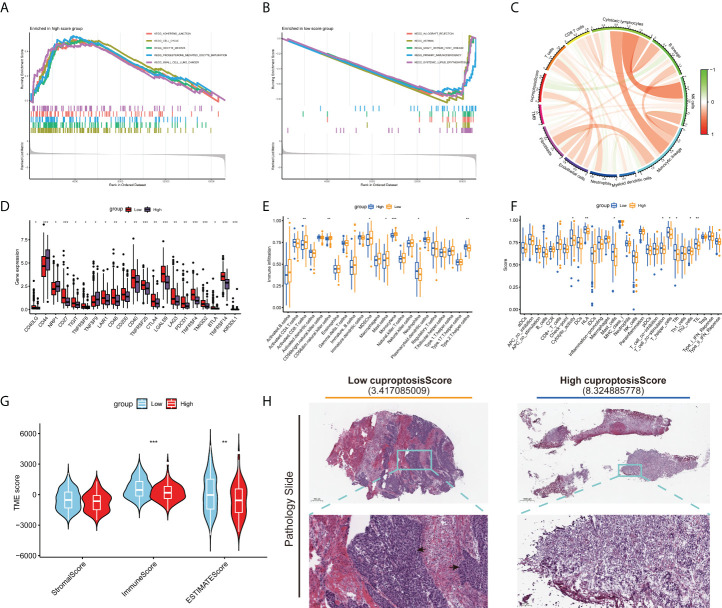
Figure 7.
Distinct TME characteristics and mutation of BLCA patients according to the cuproptosis score. GSEA shows the different pathways significantly enriched in the (A) high and (B) low cuproptosis score groups. (C) Correlations between cuproptosis score and immune cells. (D) Expression of immune checkpoints in the high and low score groups. Boxplots show (E) abundance of 23 infiltrating immune cell types and (F) differences in immune scores in the two cuproptosis score groups. (G) Correlations between cuproptosis score and both immune and stromal scores. (H) Images representing the pathological H&E staining variations between the high and low cuproptosis score groups (TCGA database). (*p < 0.05; **p < 0.01; ***p < 0.001; Ns, not significant). TME, tumor microenvironment; BLCA, bladder cancer; GSEA, gene set enrichment analysis; TCGA, The Cancer Genome Atlas.

