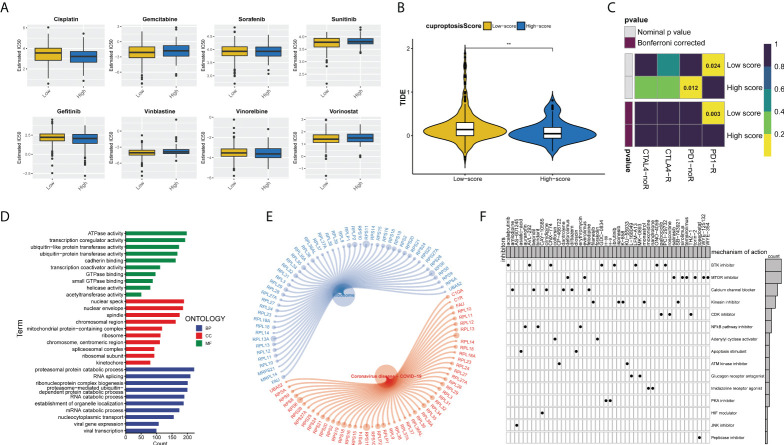
Figure 8.
Cuproptosis score predicts the responsiveness of BLCA to chemotherapy, immunotherapy, and potential small-molecule compounds. (A) Relationships between cuproptosis score and chemotherapeutic sensitivity of BLCA. (B) Violin-plots show the differences in TIDE scores between the two cuproptosis score groups. (C) The submap algorithm predicts the probability of anti-PD1 and anti-CTLA4 immunotherapy response in high and low cuproptosis groups. The low cuproptosis score group may benefit more from PD-1 treatment (Bonferroni corrected p = 0.003). R, response. (D) GO enrichment analysis ranked by adjusted p-value and (E) KEGG pathway enrichment analysis results of DEGs between the two cuproptosis score groups. (F) Dots distribution heatmap depicting small-molecule compounds and their shared drug mechanisms of action (rows) through the CMap database. (**p < 0.01). BLCA, bladder cancer; GO, Gene Ontology; KEGG, Kyoto Encyclopedia of Genes and Genomes; DEGs, differentially expressed genes; CMap, Connectivity Map.

