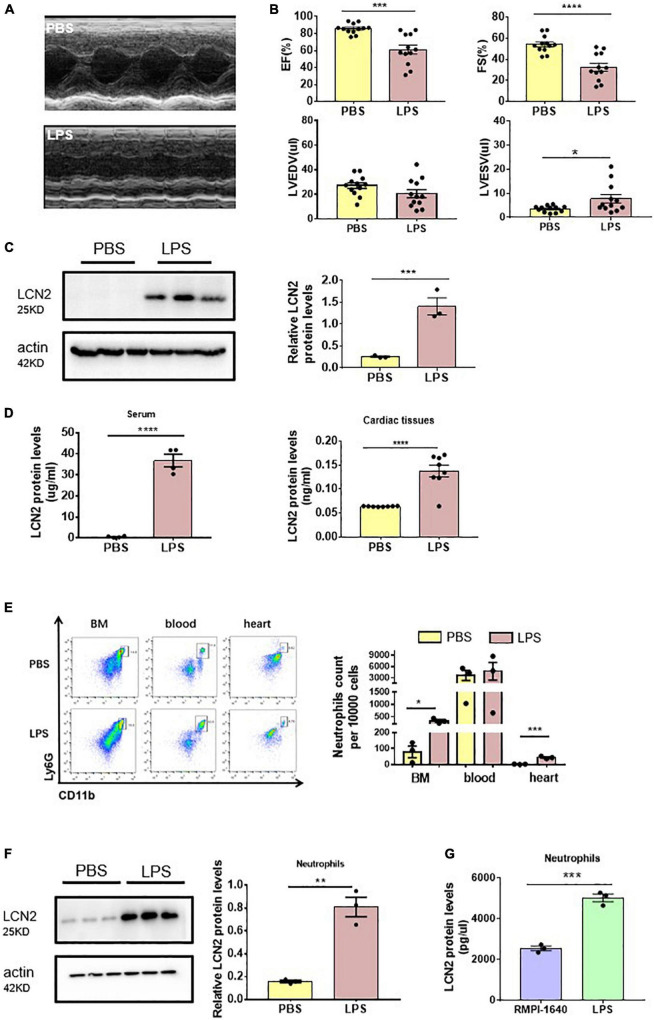
FIGURE 1.
Neutrophil-derived LCN2 was increased in LPS-induced SCD mice. (A,B) Echocardiography was performed 12 h after intraperitoneal injection of either PBS or LPS (25 mg/kg) in WT mice and their representative images (n = 12 in each group). (C) Western blot was used to analyze LCN2 expressions in heart tissues 12 h after intraperitoneal injection with either PBS or LPS (n = 3 in each group). (D) ELISA was performed to detect serum (n = 4 in each group) and cardiac LCN2 protein levels (n = 8 in each group) 12 h after intraperitoneal injection with either PBS or LPS in WT mice. (E) Flow cytometric analysis was performed to determine the number of CD45+CD11b+Ly6G+ cells in the bone marrow (BM), blood, and heart 12 h after intraperitoneal injection with either PBS (n = 3) or LPS (25 mg/kg, n = 3) in WT mice. (F) Western blot was used to analyze the LCN2 expressions in neutrophils isolated from peripheral blood 12 h post-intraperitoneal injection of PBS or LPS (25 mg/kg, n = 6 in each group) in WT mice. (G) ELISA was performed to detect the LCN2 protein levels in neutrophils after 12-h incubation with either RMPI-1640 or LPS (100 ng/ml, n = 3 in each group). Measurement data are presented as mean ± SEM. *p < 0.05, **p < 0.01, ***p < 0.001, ****p < 0.0001.

