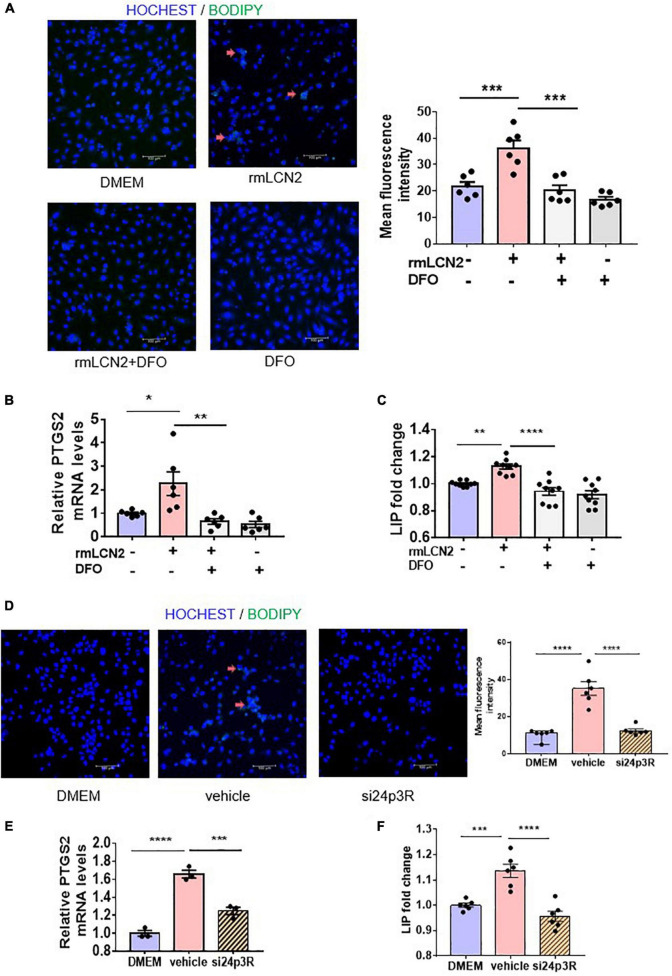
FIGURE 4.
LCN2 induced ferroptosis via increasing LIP in H9C2 cells. (A) Representative images and fluorescence intensity analysis of H9C2 cells pre-incubated with or without DFO (25 μM) for 2 h prior to incubation with rmLCN2 (1 μg/ml) for 24 h by 581/591C11-BODIPY staining (red arrows indicate the fluorescence staining, n = 3 in each group). (B) PTGS2 mRNA expressions by qPCR in H9C2 cells pre-incubated with or without DFO (25 μM) for 2 h prior to incubation with rmLCN2 (1 μg/ml) for 24 h (n = 6 in each group). (C) LIP changes in H9C2 cells pre-incubated with or without DFO (25 μM) for 2 h prior to incubation with rmLCN2 (1 μg/ml) for 24 h (n = 9 in each group). (D) Representative images and fluorescence intensity analysis of H9C2 cells pre-incubated with or without 24p3R siRNA for 48 h prior to incubation with rmLCN2 (1 μg/ml) for 24 h by 581/591C11-BODIPY staining (red arrows indicate fluorescence staining, n = 3 in each group). (E) PTGS2 mRNA expressions by qPCR in H9C2 cells pre-incubated with or without 24p3R siRNA for 48 h prior to incubation with rmLCN2 (1 μg/ml) for 24 h n = 3 in each group). (F) LIP changes in H9C2 cells pre-incubated with or without 24p3R siRNA for 48 h prior to incubation with rmLCN2 (1 μg/ml) for 24 h (n = 6 in each group). *p < 0.05, **p < 0.01, ***p < 0.001, ****p < 0.0001.

