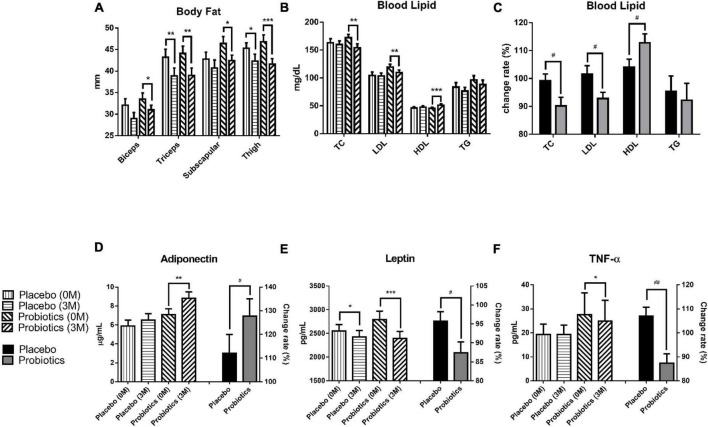
FIGURE 2.
Probiotic supplements modulated blood lipids and adipokines in obese children. (A) The thickness of the subcutaneous tissue was measured at the biceps, triceps, subscapular, and thigh before (0 M) and after (3 M) the intervention. (B) TC (total cholesterol), LDL (low-density lipoprotein), HDL (high-density lipoprotein), and TG (triacylglycerol) were measured before and after the intervention. (C) The change rates of the TC, LDL, HDL, and TG were compared between the placebo and probiotic groups. (D) The adiponectin values before (0 M) and after (3 M) the intervention are plotted on the left Y axis, and the serum adiponectin change rate in the placebo and probiotic groups is plotted on the right Y axis. (E) The serum leptin values before and after the intervention are plotted on the left Y axis, and the change rate of leptin in the placebo and probiotic groups is plotted on the right Y axis. (F) The serum TNF-α values before and after the intervention are plotted on the left Y axis and the serum TNF-α change rate in the placebo and probiotic groups is plotted on the right Y axis. Data are presented as mean ± SEM. The Wilcoxon signed rank test was used to compare the differences between before and after the intervention within the group, *p < 0.05, **p < 0.01, and ***p < 0.001. The Mann–Whitney U test was used to compare the differences between the placebo and probiotic groups: #p < 0.05 and ##p < 0.01.

