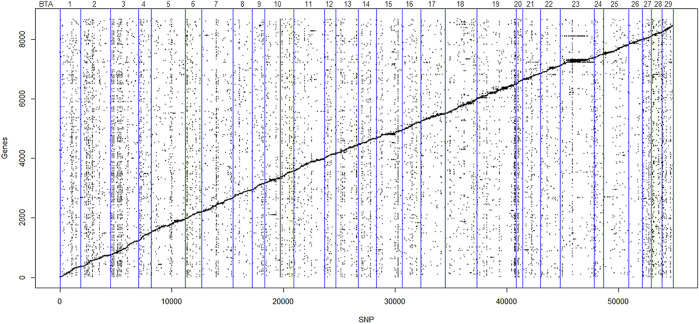
FIGURE 2.
Scatter plot of the affected genes and eQTL (FDR < 0.05). The Y-axis represents gene order in relation to chromosome position in the Bos taurus genome, and X-axis represents the SNP order in relation to chromosome position in the Bos taurus genome. Points scattered diagonally indicates cis-eQTL. Points scattered vertically indicate trans-eQTL. The vertical blue lines denote individual autosomal chromosomes.

