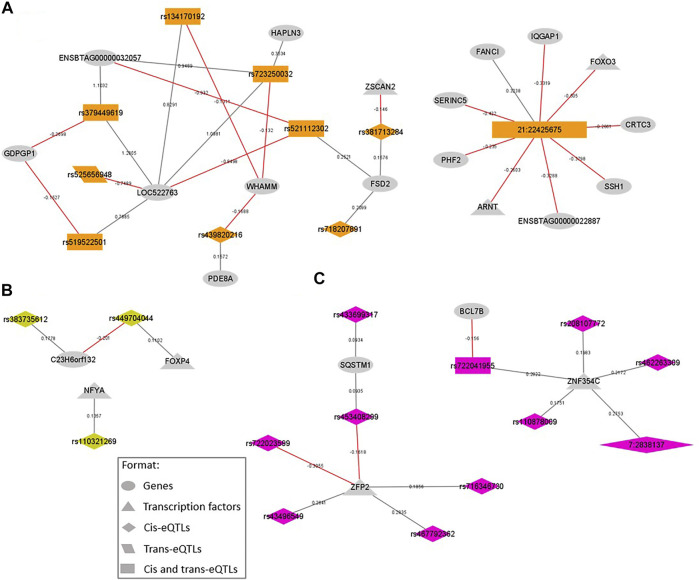
FIGURE 3.
SNP-gene regulation networks representing the eQTL variants located within QTL windows associated with intramuscular fat content (IMF) and the genes regulated by them, focusing on the variants regulating transcription factors (TFs) and their direct connections. The colors are coded by QTL window: (A) BTA21_22, eQTL represented in orange; (B) BTA23_15, eQTL represented in lightgreen; (C) BTA7_2, eQTL represented in pink. All the formats are described in the legend. New variants are represented by chromosome: position. Gray lines represent a positive beta-value and red ones represent a negative beta-value.

